Maryland Math 7.DS.C.5
Standard Cluster
Understand and apply long-run relative frequency to approximate probabilities and make predictions about chance events. Use data collection or simulation to approximate the probability of a chance event by observing its long-run relative frequency. Use a known or estimated probability to evaluate whether the number of outcomes in a given number of simulation trials is reasonable. Use visual representations (e.g., bar graphs, circle graphs) to compare and interpret probabilities.
Maryland College and Career Ready Standards for Mathematics (2025) · MODEL AND ANALYZE PROBABILITY TO INTERPRET CHANCE EVENTS, COMPARE MODELS WITH OBSERVED DATA, AND MAKE PREDICTIONS.
Cluster contents
Standards in This Cluster
7.DS.C.5 is a cluster heading. These are the individual standards under it.
- 7.DS.C.5.a
Use data collection or simulation to approximate the probability of a chance event by observing its long-run relative frequency.
- 7.DS.C.5.b
Use a known or estimated probability to evaluate whether the number of outcomes in a given number of simulation trials is reasonable.
- 7.DS.C.5.c
Use visual representations (e.g., bar graphs, circle graphs) to compare and interpret probabilities.
Teacher's field guide
What This Cluster Means
What Students Need to Do
- Students collect data or run a simulation many times. They use the share of trials with a chosen result to estimate its probability, predict future counts, and compare probabilities on graphs.
What Mastery Looks Like
- Given 36 reds in 120 spins of a red-blue spinner, a student estimates a 30% chance of red and predicts about 60 reds in 200 more spins. They explain why a count near 60 is reasonable but not guaranteed, and show red at 30% and blue at 70% on a bar graph.
Common Misconceptions
- Students may divide the number of red results by the number of colors instead of the number of trials. They may expect exactly 30 reds in every 100 spins or think a streak of blue makes red due. Some graph raw counts but label the bars as percentages.
How to Assess It
- Exit ticket: A spinner lands red 48 times in 200 spins. Estimate the chance of red, predict the red count in 100 more spins, decide whether 90 reds would be reasonable, and draw a probability bar graph for red and not red.
Lesson moves
Ways to Teach It
Give pairs a cup with red and blue counters; have them draw, replace, and record 100 results, then plot the running red frequency.
Ask, "A spinner landed red 18 times in 60 spins. Would 70 reds in the next 80 spins surprise you? Why?"
Play probability match with cards showing 15 reds in 50 spins, 30%, and a bar graph with a 30% red bar.
Model a 30% rain forecast with 100 ten-sided die rolls, counting 1 to 3 as rain, then compare the count with 30.
Free download
Printable 7.DS.C.5 Worksheet
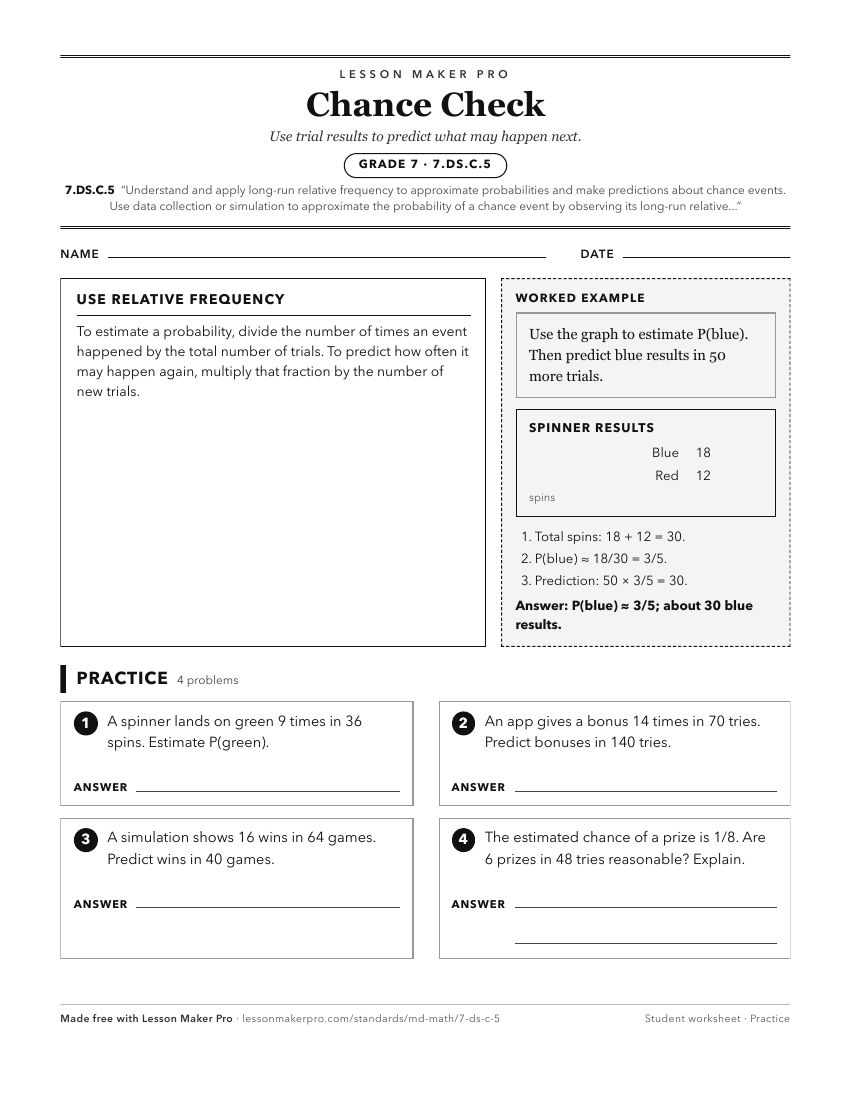
A ready-to-print activity worksheet aligned to 7.DS.C.5, with an answer key for the teacher on its own page. No account needed.
PDF, US Letter, prints cleanly in black and white.
Download the worksheetKeep exploring
Related Standards
Turn this cluster into a lesson
Grade, subject, topic, and the complete cluster are prefilled. Create one free, no account needed.
Also for this cluster:Make a WorksheetMake a QuizMake a Sub Lesson