Maryland Math 7.DS.C.5.c
The Standard
- 7.DS.C.5
- Understand and apply long-run relative frequency to approximate probabilities and make predictions about chance events.
Use visual representations (e.g., bar graphs, circle graphs) to compare and interpret probabilities.
Maryland College and Career Ready Standards for Mathematics (2025) · MODEL AND ANALYZE PROBABILITY TO INTERPRET CHANCE EVENTS, COMPARE MODELS WITH OBSERVED DATA, AND MAKE PREDICTIONS.
Teacher's field guide
What This Standard Means
What Students Need to Do
- Students read bar graphs and circle graphs that show the chances of different outcomes. They compare bar heights or slice sizes to say which outcomes are more or less likely.
What Mastery Looks Like
- A student can identify the most and least likely outcomes in either graph. They use the graph's numbers or labels to explain the comparison without treating a likely outcome as guaranteed.
Common Misconceptions
- Students may think the largest slice shows what will definitely happen. They may compare bar heights without checking the scale, or read 0.25 as 25 events instead of a 25% chance.
How to Assess It
- Exit ticket: Sketch a circle graph with one quarter red and three quarters blue. Which color is more likely, and how does the graph show it?
Lesson moves
Ways to Teach It
Spin a spinner with one red quarter and three blue quarters 20 times, then compare a tally bar graph with the spinner's sections.
Show a circle graph with half red, one quarter blue, and one quarter green; ask which color is most likely and why.
Give partners probability bar graphs with different scales; have them compare events and defend their answers using the axis labels.
Use a forecast of 20% rain Saturday and 60% Sunday; draw probability bars and choose a picnic day.
Free download
Printable 7.DS.C.5.c Worksheet
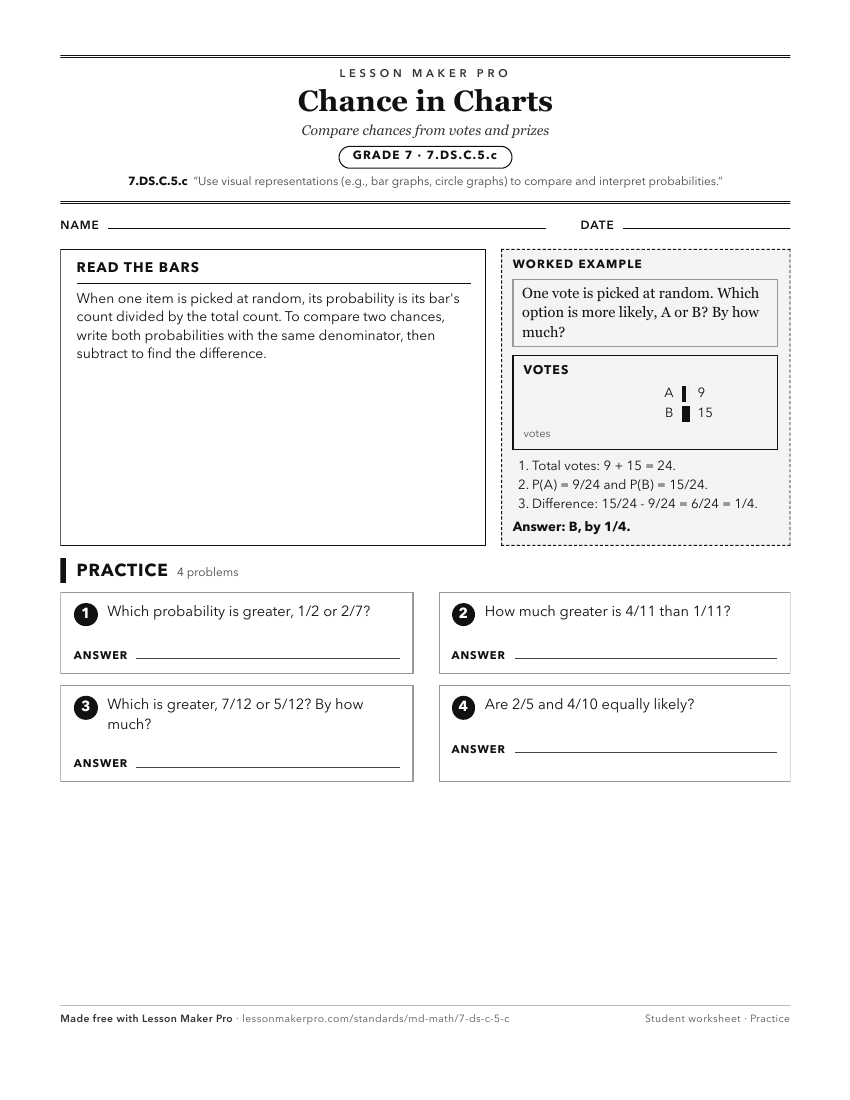
A ready-to-print activity worksheet aligned to 7.DS.C.5.c, with an answer key for the teacher on its own page. No account needed.
PDF, US Letter, prints cleanly in black and white.
Download the worksheetKeep exploring
Related Standards
- 2.DS.A.1.c
Represent categorical data using picture graphs and bar graphs. Represent numerical data using line plots.
- 7.DS.B.3.a
Use histograms and other visualizations to describe similarities and differences in the range, shape, and clustering of the data sets.
- 5.AT.B.3.c
Use tables, ordered pairs, and graphs to represent the relationship between quantities.
- 7.DS.C.6
Develop and use probability models to find probabilities of events and compare them to observed results.
Turn this exact standard into a lesson
Grade, subject, topic, and the complete standard are prefilled. Create one free, no account needed.
Also for this standard:Make a WorksheetMake a QuizMake a Sub Lesson