Maryland Math 2.DS.A.1.c
The Standard
- 2.DS.A.1
- Ask and answer questions by collecting, organizing and summarizing data.
Represent categorical data using picture graphs and bar graphs. Represent numerical data using line plots.
Maryland College and Career Ready Standards for Mathematics (2025) · REPRESENT AND INTERPRET DATA.
Teacher's field guide
What This Standard Means
What Students Need to Do
- Students sort answers into categories and show the counts in picture graphs and bar graphs. They put number data on a line plot, with one mark for each value.
What Mastery Looks Like
- A student can turn the same class vote into a picture graph and a bar graph with correct labels and counts. They can place repeated measurements as stacked marks above the right numbers on a line plot.
Common Misconceptions
- Students may draw one picture for a category instead of one for each vote. They may count the lines on a bar graph instead of its spaces, or put repeated values at different spots on a line plot.
How to Assess It
- Exit ticket: Give students fruit votes of apple 3, banana 5, and pear 2, plus pencil lengths of 4, 5, 5, and 6 inches. Ask for a bar graph of the votes and a line plot of the lengths.
Lesson moves
Ways to Teach It
Survey classmates about their favorite recess game, stack one cube per vote, then draw a picture graph and a bar graph.
Show two graphs of the same snack votes and ask, 'How can you tell both show six votes for apples?'
Roll a die eight times, then place one X per roll above the matching number on a line plot.
Measure ten classroom pencils to the nearest inch, then make a line plot of their lengths.
Free download
Printable 2.DS.A.1.c Worksheet
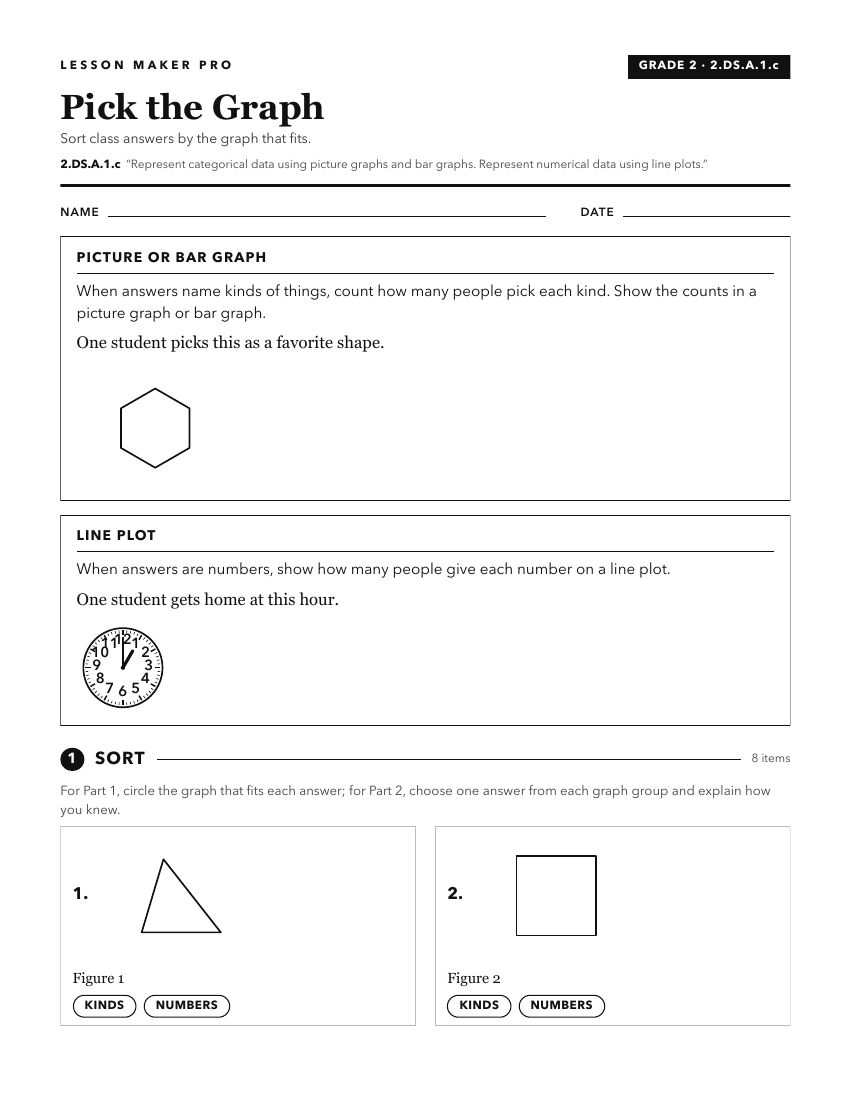
A ready-to-print activity worksheet aligned to 2.DS.A.1.c, with an answer key for the teacher on its own page. No account needed.
PDF, US Letter, prints cleanly in black and white.
Download the worksheetKeep exploring
Related Standards
- 1.DS.A.1.c
Represent data by creating tally charts and picture graphs.
- 3.DS.A.1.a
Create a scaled data visualization (e.g., picture graph, bar graph for categorial data; line plot with fraction units of halves and fourths for numerical data) ...
- 5.DS.A.1.a
Create scaled data visualization (e.g. bar graphs for categorical data; line plots with fraction units of halves, fourths, and eighths for numerical data) to di...
- 6.DS.B.5
Interpret numerical data in plots on a number line, including line plots, histograms, and box plots.
Turn this exact standard into a lesson
Grade, subject, topic, and the complete standard are prefilled. Create one free, no account needed.
Also for this standard:Make a WorksheetMake a QuizMake a Sub Lesson