Maryland Math 1.DS.A.1.c
The Standard
- 1.DS.A.1
- Ask and answer questions by collecting, organizing and summarizing data.
Represent data by creating tally charts and picture graphs.
Maryland College and Career Ready Standards for Mathematics (2025) · REPRESENT AND INTERPRET DATA.
Teacher's field guide
What This Standard Means
What Students Need to Do
- Students sort items or responses into groups and record one tally mark for each. They draw a picture graph with one picture for each item and label the groups.
What Mastery Looks Like
- Given a small set of votes, a student makes a tally chart and picture graph with matching counts. They label each group and can check each picture against a tally mark.
Common Misconceptions
- Some students make one tally mark for a whole group instead of one per item. Others draw one picture for each group instead of each item, or leave groups unlabeled.
How to Assess It
- Give students 4 apples, 2 pears, and 3 bananas. Ask them to make a labeled tally chart and a picture graph with one picture for each fruit.
Lesson moves
Ways to Teach It
Give each pair a bag of red, blue, and green cubes; have them sort, tally, and draw one picture per cube.
Show a tally chart and picture graph of pet choices; ask, 'Do they show the same count for each pet? How can you tell?'
Play graph match: give pairs tally cards and picture graph cards to match by count.
Survey classmates about school lunch or packed lunch, then make a tally chart and picture graph of their answers.
Free download
Printable 1.DS.A.1.c Worksheet
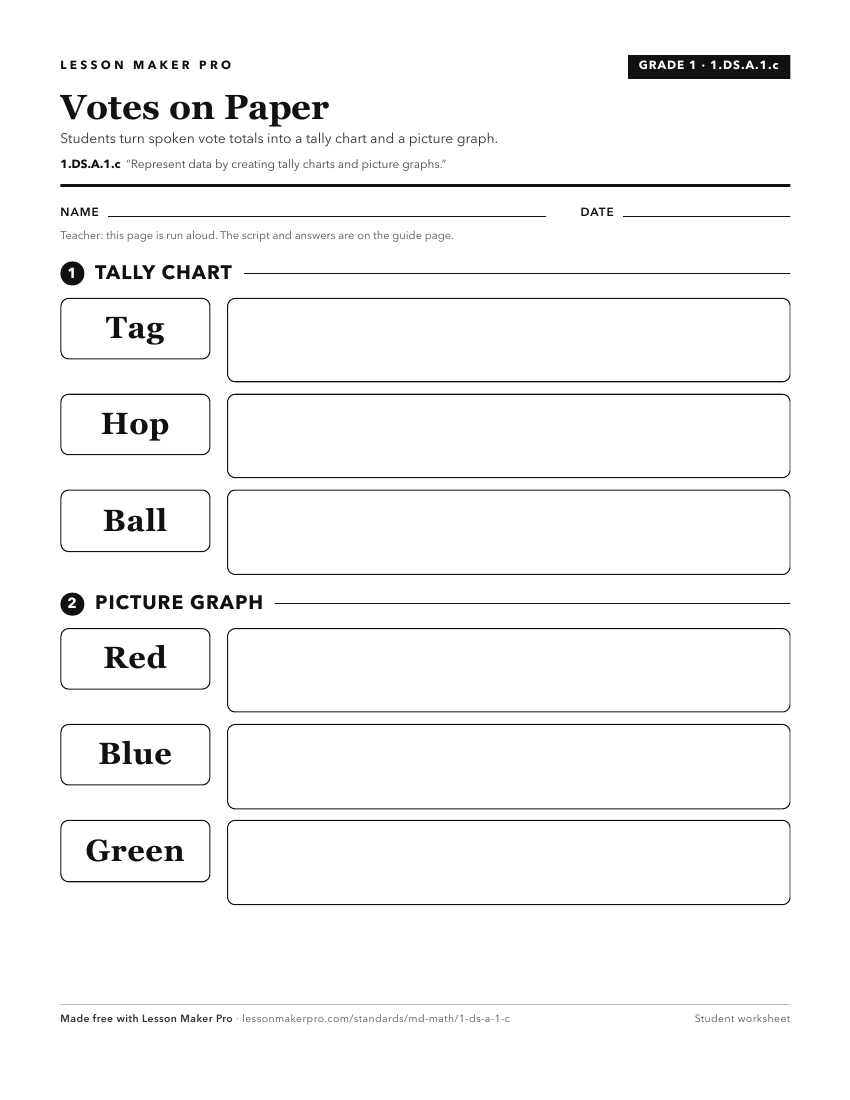
A ready-to-print activity worksheet aligned to 1.DS.A.1.c, with an answer key for the teacher on its own page. No account needed.
PDF, US Letter, prints cleanly in black and white.
Download the worksheetKeep exploring
Related Standards
- 2.DS.A.1.c
Represent categorical data using picture graphs and bar graphs. Represent numerical data using line plots.
- 3.DS.A.1.a
Create a scaled data visualization (e.g., picture graph, bar graph for categorial data; line plot with fraction units of halves and fourths for numerical data) ...
- 3.DS.A.1.b
Summarize data presented in scaled data visualizations (e.g., picture graph, bar graph for categorial data; line plot for numerical data) by describing the stor...
- 5.DS.A.1.a
Create scaled data visualization (e.g. bar graphs for categorical data; line plots with fraction units of halves, fourths, and eighths for numerical data) to di...
Turn this exact standard into a lesson
Grade, subject, topic, and the complete standard are prefilled. Create one free, no account needed.
Also for this standard:Make a WorksheetMake a QuizMake a Sub Lesson