Maryland Math 3.DS.A.1.b
The Standard
- 3.DS.A.1
- Ask and answer questions by collecting, organizing and summarizing data, recognizing the importance of context when analyzing data.
Summarize data presented in scaled data visualizations (e.g., picture graph, bar graph for categorial data; line plot for numerical data) by describing the story the data is telling.
Maryland College and Career Ready Standards for Mathematics (2025) · REPRESENT AND INTERPRET DATA.
Teacher's field guide
What This Standard Means
What Students Need to Do
- Students check the key or scale before reading a graph. They describe what the data shows, using counts and comparisons rather than listing every value.
What Mastery Looks Like
- A student reads picture graphs, bar graphs, and line plots accurately. They can explain a pattern, such as a popular choice or where measurements cluster, and support it with numbers.
Common Misconceptions
- Students may count each picture as one even when the key says two. They may ignore the bar graph's scale or treat the Xs on a line plot as a timeline instead of counts at each value.
How to Assess It
- Show a bar graph with a scale of two and bars for 8 apple votes, 4 banana votes, and 6 pear votes. Ask, "What does this graph tell us about fruit choices? Use two numbers in your answer."
Lesson moves
Ways to Teach It
Give pairs 12 sticky-note fruit votes; have them group votes in twos, build a scaled picture graph, and say what it shows.
Show a bar graph, scaled by two, with 10 pizza, 6 sandwich, and 2 salad votes; ask which lunch choice stands out and why.
Play Graph Detective: plot pencil lengths of 4, 4, 5, 5, 5, and 6 inches; partners swap one-sentence summaries and check the counts.
Show a library checkout bar graph, scaled by two, with 10 comic, 6 animal, and 4 sports books; ask which shelf needs restocking.
Free download
Printable 3.DS.A.1.b Worksheet
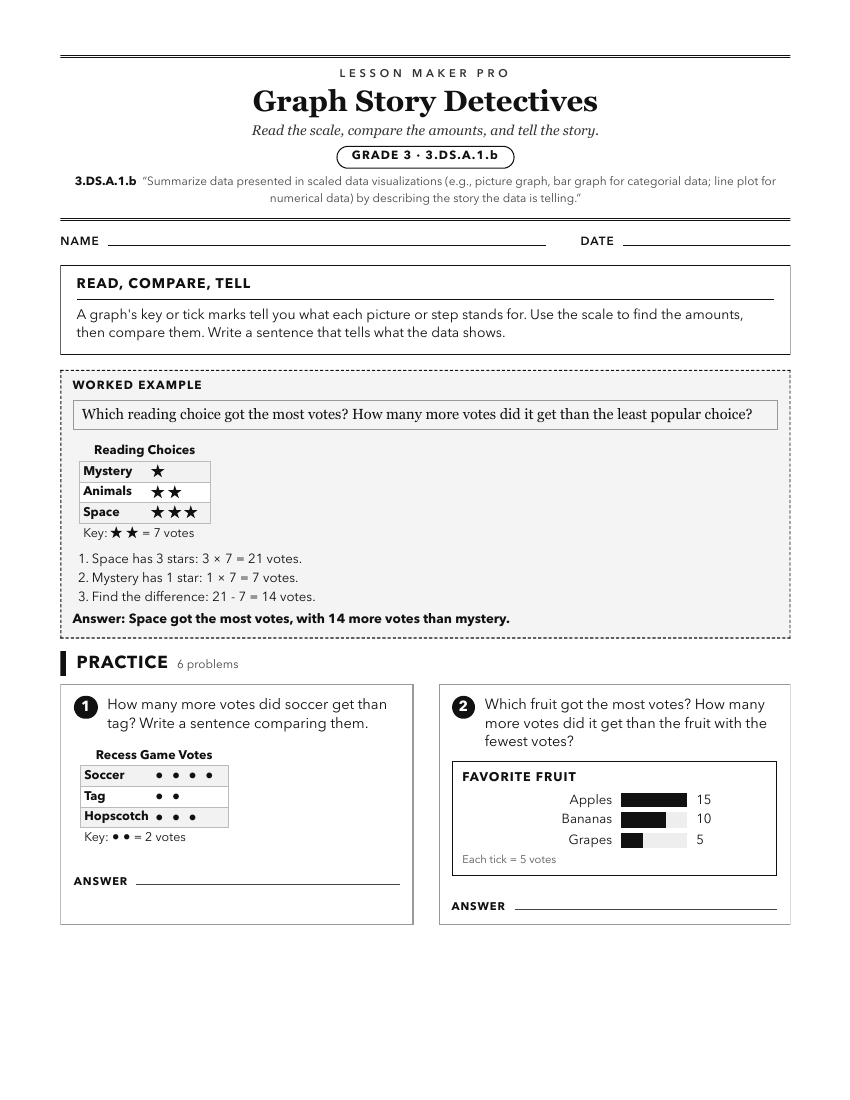
A ready-to-print activity worksheet aligned to 3.DS.A.1.b, with an answer key for the teacher on its own page. No account needed.
PDF, US Letter, prints cleanly in black and white.
Download the worksheetKeep exploring
Related Standards
- 4.DS.A.1.b
Summarize data presented in scaled data visualizations (e.g. bar graphs, line plots) and draw conclusions about the data.
- 5.DS.A.1.b
Summarize data presented in scaled visualizations (e.g. bar graphs, circle graphs, line plots, line graphs) by identifying the mode, the range, and any gaps in ...
- 3.DS.A.1.a
Create a scaled data visualization (e.g., picture graph, bar graph for categorial data; line plot with fraction units of halves and fourths for numerical data) ...
- 5.DS.A.1.a
Create scaled data visualization (e.g. bar graphs for categorical data; line plots with fraction units of halves, fourths, and eighths for numerical data) to di...
Turn this exact standard into a lesson
Grade, subject, topic, and the complete standard are prefilled. Create one free, no account needed.
Also for this standard:Make a WorksheetMake a QuizMake a Sub Lesson