Maryland Math 6.DS.B.5
The Standard
Interpret numerical data in plots on a number line, including line plots, histograms, and box plots.
Maryland College and Career Ready Standards for Mathematics (2025) · SUMMARIZE AND DESCRIBE DISTRIBUTIONS
Teacher's field guide
What This Standard Means
What Students Need to Do
- Students read number scales to describe where data values fall and how spread out they are. They count marks on line plots, read groups of values in histograms, and use medians and quartiles in box plots.
What Mastery Looks Like
- A student can find how many values a line plot or histogram shows in a given range. They can identify the median and middle half of a box plot, and say when a plot does not show an exact value.
Common Misconceptions
- Students may read a histogram bar’s height as a data value instead of a count. They may count a stack on a line plot as one value instead of counting every mark. They may think a box plot shows how many values fall at each number.
How to Assess It
- Show a histogram with bins 0–4: 2 values, 5–9: 6 values, and 10–14: 3 values. Ask, “How many values are at least 5? Can you tell how many equal 7? Explain.”
Lesson moves
Ways to Teach It
Have students place sticky notes for 2, 2, 3, 4, 4, 4, 5 on a numbered tape, then count values above 3.
Show a box plot with minimum 2, quartiles 4 and 9, median 6, and maximum 12; ask what share falls between 4 and 9.
Give pairs line plots, histograms, box plots, and claim cards like “The median is 7”; have them match claims to plots.
Show a histogram of monthly library visits with bins 0–2: 5, 3–5: 9, and 6–8: 4; ask how many visited at least three times.
Free download
Printable 6.DS.B.5 Worksheet
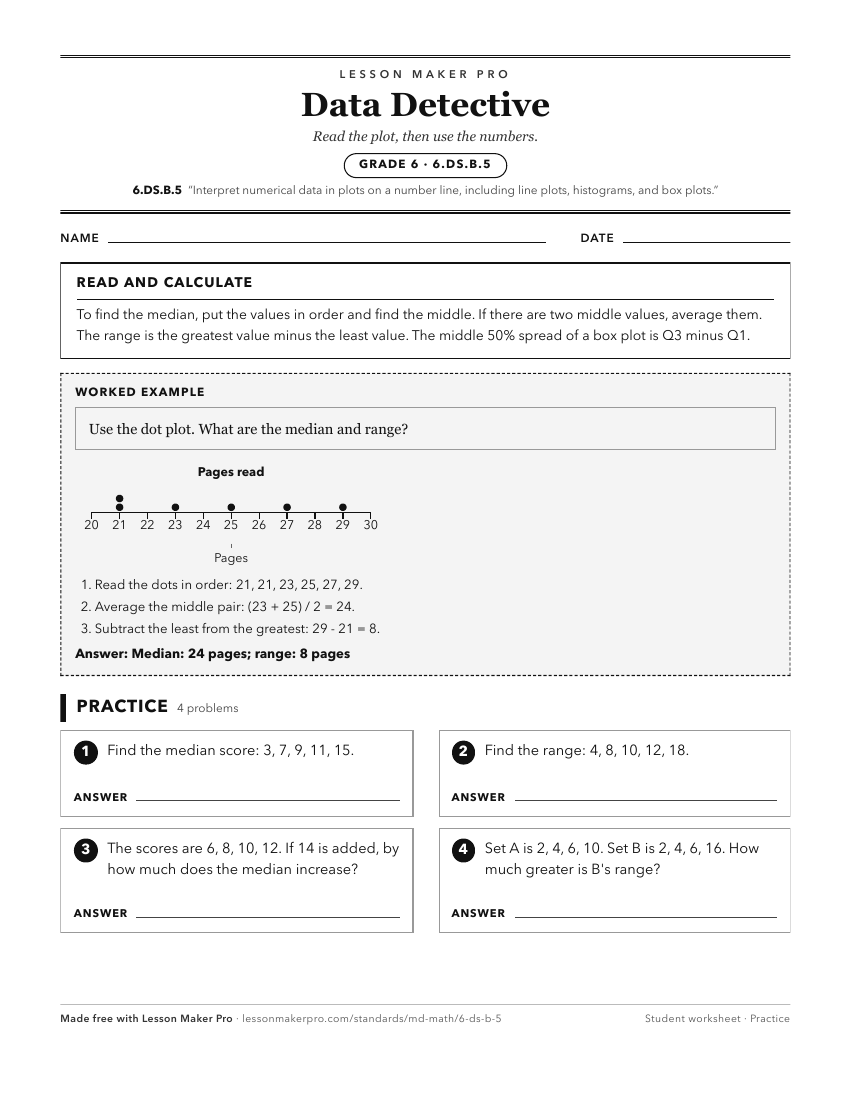
A ready-to-print activity worksheet aligned to 6.DS.B.5, with an answer key for the teacher on its own page. No account needed.
PDF, US Letter, prints cleanly in black and white.
Download the worksheetKeep exploring
Related Standards
- 2.DS.A.1.c
Represent categorical data using picture graphs and bar graphs. Represent numerical data using line plots.
- 5.DS.A.1.a
Create scaled data visualization (e.g. bar graphs for categorical data; line plots with fraction units of halves, fourths, and eighths for numerical data) to di...
- 4.DS.A.1.a
Create scaled data visualization (e.g. bar graphs for categorical data; line plots with fraction units of halves, fourths, and eighths for numerical data) to di...
Turn this exact standard into a lesson
Grade, subject, topic, and the complete standard are prefilled. Create one free, no account needed.
Also for this standard:Make a WorksheetMake a QuizMake a Sub Lesson