Maryland Math 7.DS.C.6
Standard Cluster
Develop and use probability models to find probabilities of events and compare them to observed results. Create a uniform probability model for situations where outcomes are equally likely and use the model to calculate the probability of an event. Create a probability model using observed frequencies and use it to estimate the probability of an event. Compare probabilities from a model to observed data and explain possible reasons for any differences.
Maryland College and Career Ready Standards for Mathematics (2025) · MODEL AND ANALYZE PROBABILITY TO INTERPRET CHANCE EVENTS, COMPARE MODELS WITH OBSERVED DATA, AND MAKE PREDICTIONS.
Cluster contents
Standards in This Cluster
7.DS.C.6 is a cluster heading. These are the individual standards under it.
Teacher's field guide
What This Cluster Means
What Students Need to Do
- Students calculate probabilities when outcomes are equally likely. They also use trial counts to estimate probabilities, compare those estimates with predictions, and explain differences.
What Mastery Looks Like
- For a fair die, a student finds the chance of an even roll as 3/6. Given 17 even rolls in 40 trials, they use 17/40 as an estimate and explain that random variation can cause the difference.
Common Misconceptions
- Students may assume every color in a bag has the same chance, even when the bag holds more of one color. They may divide an observed count by the number of possible outcomes instead of the number of trials. Some think any difference between a prediction and the results proves the model is wrong.
How to Assess It
- Exit ticket: A spinner has four equal sections and lands on red 6 times in 20 spins. Give the model probability and the observed estimate for red, then explain why they differ.
Lesson moves
Ways to Teach It
Make a four-section paper spinner, predict the chance of blue, spin 40 times, and compare predicted and observed fractions.
Present 9 heads in 20 coin flips and have students write whether that proves the coin is unfair, with a reason.
Give pairs die-event cards and 30-roll tally cards; have them match each event to its predicted and observed probabilities.
Use a 20-day bus arrival chart; count late buses and estimate the chance the next bus will be late.
Free download
Printable 7.DS.C.6 Worksheet
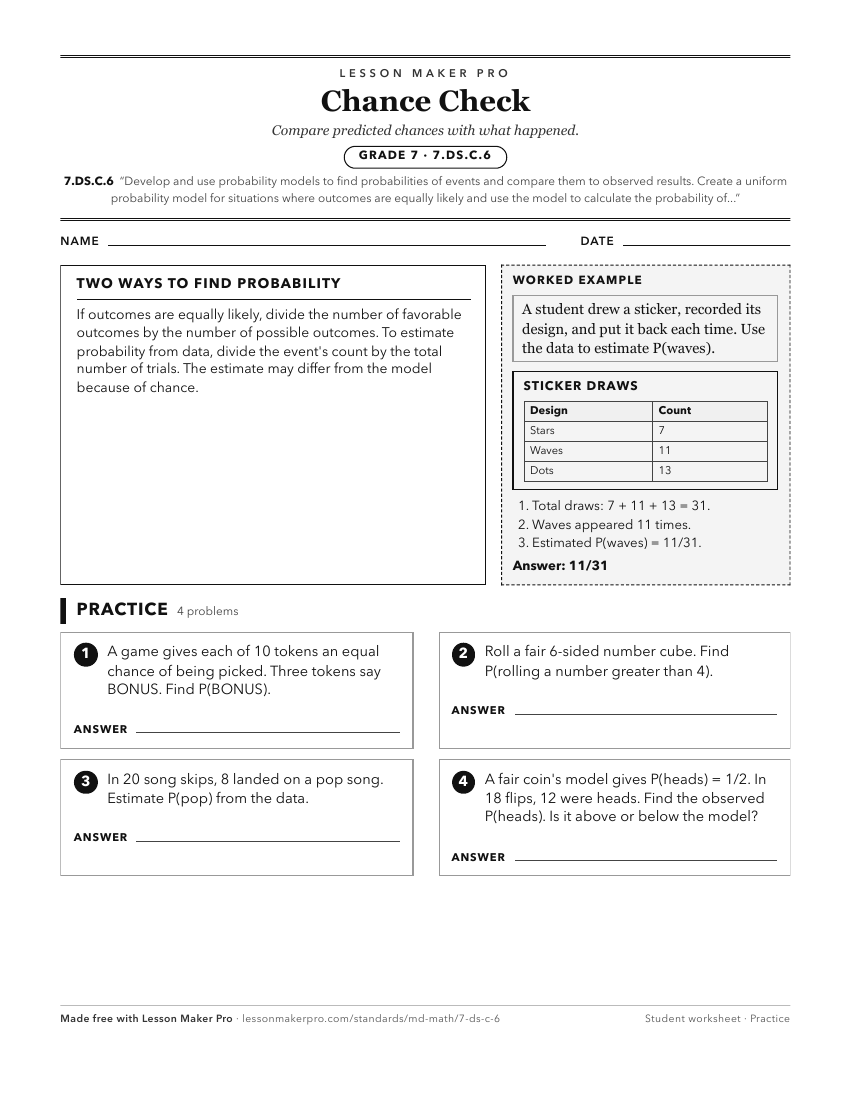
A ready-to-print activity worksheet aligned to 7.DS.C.6, with an answer key for the teacher on its own page. No account needed.
PDF, US Letter, prints cleanly in black and white.
Download the worksheetKeep exploring
Related Standards
Turn this cluster into a lesson
Grade, subject, topic, and the complete cluster are prefilled. Create one free, no account needed.
Also for this cluster:Make a WorksheetMake a QuizMake a Sub Lesson