Maryland Math 3.DS.A.1
Standard Cluster
Ask and answer questions by collecting, organizing and summarizing data, recognizing the importance of context when analyzing data. Create a scaled data visualization (e.g., picture graph, bar graph for categorial data; line plot with fraction units of halves and fourths for numerical data) to display collected or given data. Summarize data presented in scaled data visualizations (e.g., picture graph, bar graph for categorial data; line plot for numerical data) by describing the story the data is telling. Identify patterns in the data and evaluate whether these patterns might apply to different contexts or situations.
Maryland College and Career Ready Standards for Mathematics (2025) · REPRESENT AND INTERPRET DATA.
Cluster contents
Standards in This Cluster
3.DS.A.1 is a cluster heading. These are the individual standards under it.
- 3.DS.A.1.a
Create a scaled data visualization (e.g., picture graph, bar graph for categorial data; line plot with fraction units of halves and fourths for numerical data) ...
- 3.DS.A.1.b
Summarize data presented in scaled data visualizations (e.g., picture graph, bar graph for categorial data; line plot for numerical data) by describing the stor...
- 3.DS.A.1.c
Identify patterns in the data and evaluate whether these patterns might apply to different contexts or situations.
Teacher's field guide
What This Cluster Means
What Students Need to Do
- Students ask a question, collect class answers or measurements, and organize them in a tally table. They make a scaled picture or bar graph, or a line plot marked in halves and fourths. They use the graph to answer questions, describe a pattern, and decide whether it might hold for another group.
What Mastery Looks Like
- A student reads a scale of two or five correctly, places measurements at the right quarter-inch marks, and uses counts to compare groups. They explain what a pattern says about the group surveyed without claiming it fits every class.
Common Misconceptions
- Students may count each picture as one even when the key says it stands for two. They may place 2 1/4 at 2 1/2 on a line plot. They may assume a class survey shows what all third graders prefer.
How to Assess It
- Exit ticket: Plot these pencil lengths, in inches, on a line plot: 3, 3 1/4, 3 1/4, 3 1/2, 3 3/4. State the most common length and explain whether pencils in another class must show the same pattern.
Lesson moves
Ways to Teach It
Give each group five pencils and a ruler; measure to the nearest quarter inch and mark each length with an X on a line plot.
Ask, “Our class chose apples most often. Would every third-grade class choose apples most often? What would you need to check?”
Give pairs snack votes of 4 apples, 6 bananas, and 8 crackers; have them draw a pictograph with two votes per symbol and compare totals.
Make a scaled bar graph of today's cafeteria meal choices from a posted tally, then tell the lunch staff which option needs the most servings.
Free download
Printable 3.DS.A.1 Worksheet
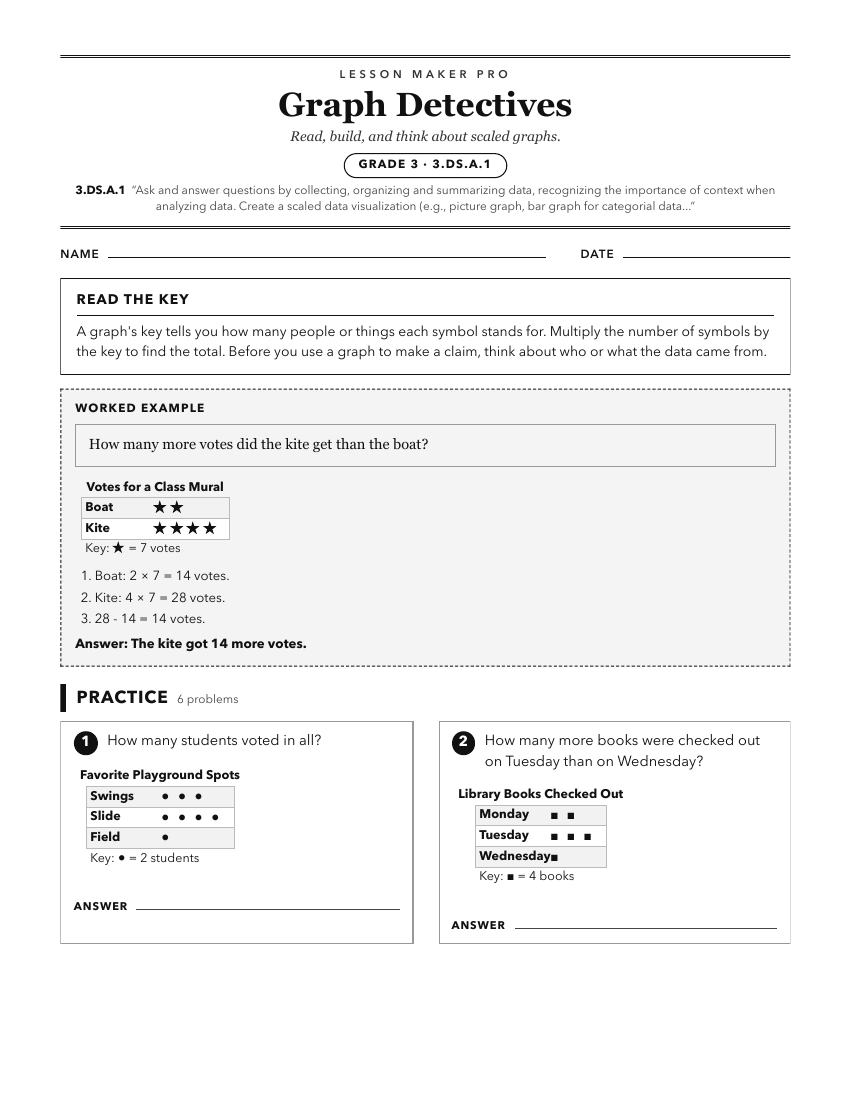
A ready-to-print activity worksheet aligned to 3.DS.A.1, with an answer key for the teacher on its own page. No account needed.
PDF, US Letter, prints cleanly in black and white.
Download the worksheetKeep exploring
Related Standards
Turn this cluster into a lesson
Grade, subject, topic, and the complete cluster are prefilled. Create one free, no account needed.
Also for this cluster:Make a WorksheetMake a QuizMake a Sub Lesson