Maryland Math 1.DS.A.1
Standard Cluster
Ask and answer questions by collecting, organizing and summarizing data. Craft a question that can be answered by collecting categorical data. Collect and organize categorical data (into up to three categories) using surveys or observations. Represent data by creating tally charts and picture graphs. Summarize the data presented in tally charts using “most,” “least,” “greater than,” “less than,” and “equal to”.
Maryland College and Career Ready Standards for Mathematics (2025) · REPRESENT AND INTERPRET DATA.
Cluster contents
Standards in This Cluster
1.DS.A.1 is a cluster heading. These are the individual standards under it.
- 1.DS.A.1.a
Craft a question that can be answered by collecting categorical data.
- 1.DS.A.1.b
Collect and organize categorical data (into up to three categories) using surveys or observations.
- 1.DS.A.1.c
Represent data by creating tally charts and picture graphs.
- 1.DS.A.1.d
Summarize the data presented in tally charts using “most,” “least,” “greater than,” “less than,” and “equal to”.
Teacher's field guide
What This Cluster Means
What Students Need to Do
- Students ask a question with up to three choices, then collect answers or count what they observe. They record the results in a tally chart and a picture graph. They use the charts to say which groups have more, fewer, or the same number.
What Mastery Looks Like
- A student records each answer once, and the totals in their tally chart and picture graph match. They can name the most and least common choices and spot when two groups are equal.
Common Misconceptions
- Some students make one tally mark for each choice instead of each response. Others draw one picture per choice instead of one per response. They may miss a tie or mix up greater than and less than.
How to Assess It
- Ask, 'Which fruit do you prefer: apples, bananas, or grapes?' Have students survey six classmates, make a tally chart and picture graph, then write one comparison between two fruits.
Lesson moves
Ways to Teach It
Give pairs 12 red, blue, and yellow buttons to sort, tally, and show on a picture graph with one picture per button.
Show a chart with four cats, four dogs, and two fish; ask, 'Which groups are equal, and which has the least?'
Play Survey Sprint: partners ask six classmates to choose red, blue, or green, then swap tally charts to check the counts.
At lunch, tally classmates who chose milk, water, or juice, then make a picture graph of the results.
Free download
Printable 1.DS.A.1 Worksheet
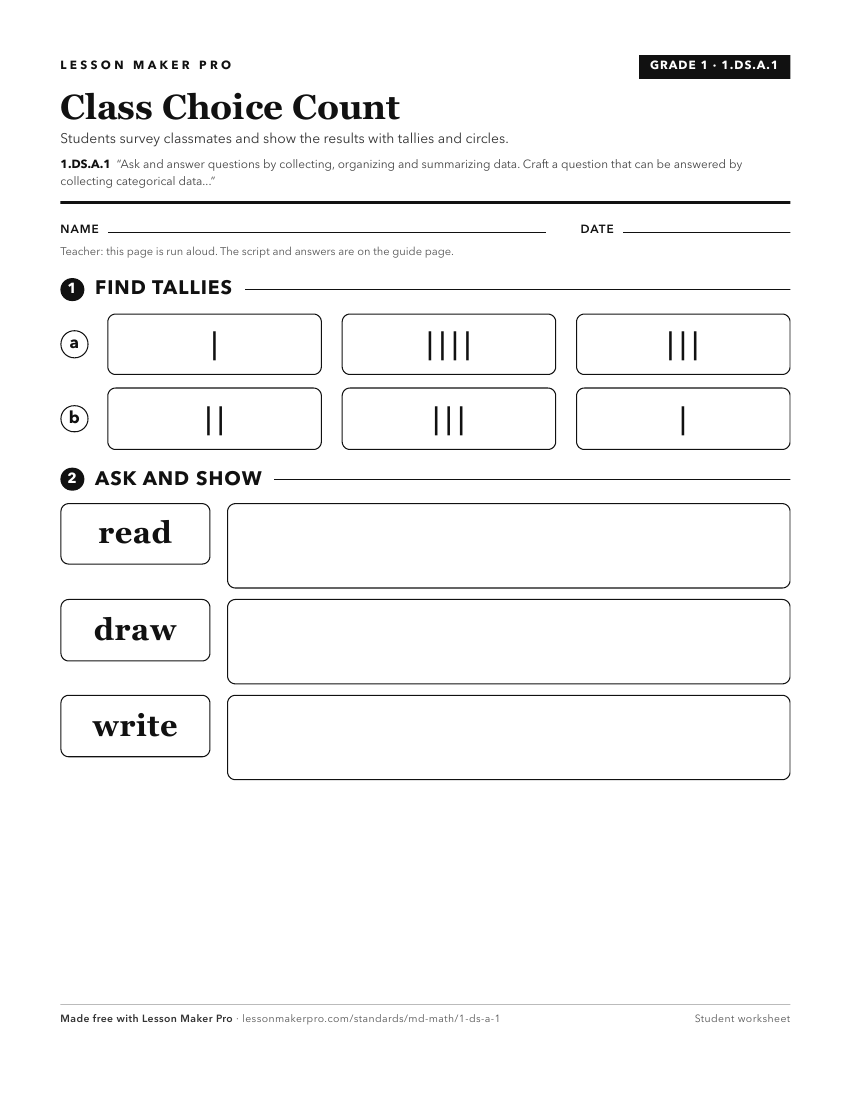
A ready-to-print activity worksheet aligned to 1.DS.A.1, with an answer key for the teacher on its own page. No account needed.
PDF, US Letter, prints cleanly in black and white.
Download the worksheetKeep exploring
Related Standards
- 3.DS.A.1
Ask and answer questions by collecting, organizing and summarizing data, recognizing the importance of context when analyzing data.
- 5.DS.A.1
Ask and answer questions by collecting, organizing and summarizing data, recognizing the importance of context when analyzing data.
- 4.DS.A.1
Ask and answer questions by collecting, organizing and summarizing data, recognizing the importance of context when analyzing data.
- 2.DS.A.1
The 2nd Grade version of this standard.
Turn this cluster into a lesson
Grade, subject, topic, and the complete cluster are prefilled. Create one free, no account needed.
Also for this cluster:Make a WorksheetMake a QuizMake a Sub Lesson