Maryland Math 5.DS.A.1
Standard Cluster
Ask and answer questions by collecting, organizing and summarizing data, recognizing the importance of context when analyzing data. Create scaled data visualization (e.g. bar graphs for categorical data; line plots with fraction units of halves, fourths, and eighths for numerical data) to display data and communicate relationships or support a claim. Summarize data presented in scaled visualizations (e.g. bar graphs, circle graphs, line plots, line graphs) by identifying the mode, the range, and any gaps in data and draw conclusions. Evaluate whether a data visualization accurately represents the data and allows for accurate interpretation given the context.
Maryland College and Career Ready Standards for Mathematics (2025) · REPRESENT AND INTERPRET DATA.
Cluster contents
Standards in This Cluster
5.DS.A.1 is a cluster heading. These are the individual standards under it.
- 5.DS.A.1.a
Create scaled data visualization (e.g. bar graphs for categorical data; line plots with fraction units of halves, fourths, and eighths for numerical data) to di...
- 5.DS.A.1.b
Summarize data presented in scaled visualizations (e.g. bar graphs, circle graphs, line plots, line graphs) by identifying the mode, the range, and any gaps in ...
- 5.DS.A.1.c
Evaluate whether a data visualization accurately represents the data and allows for accurate interpretation given the context.
Teacher's field guide
What This Cluster Means
What Students Need to Do
- Students ask a question, collect data, and make a graph with a clear scale. They use the context to describe patterns, find the mode, range, and gaps when the data allows, and check whether the graph gives a fair picture.
What Mastery Looks Like
- A student makes a scaled bar graph for categories or an evenly spaced line plot for measurements in eighths. They read bar, circle, and line graphs, explain a pattern using the data, and notice when a scale exaggerates a difference.
Common Misconceptions
- Students may space fractions unevenly or read bar heights without checking the scale. They may call the largest value the mode, count values instead of subtracting to find the range, or miss an axis that starts above zero.
How to Assess It
- Exit ticket: Plot reading times of 1/8, 1/8, 3/8, and 5/8 hour on a line plot marked in eighths. Name the mode, range, and one gap, then explain why the tick marks must be evenly spaced.
Lesson moves
Ways to Teach It
Measure classmates' pencil lengths to the nearest eighth inch, then place sticky notes on a line plot marked in eighths.
Show two bar graphs of the same class vote, one starting at zero and one at five; ask, 'Which makes the lead look bigger?'
Use cards marked 1/8, 2/8, 2/8, 2/8, 4/8, and 6/8 to race: plot them, then name the mode, range, and gaps.
Survey how classmates travel to school, make a bar graph with two students per tick, and explain the most common way.
Free download
Printable 5.DS.A.1 Worksheet
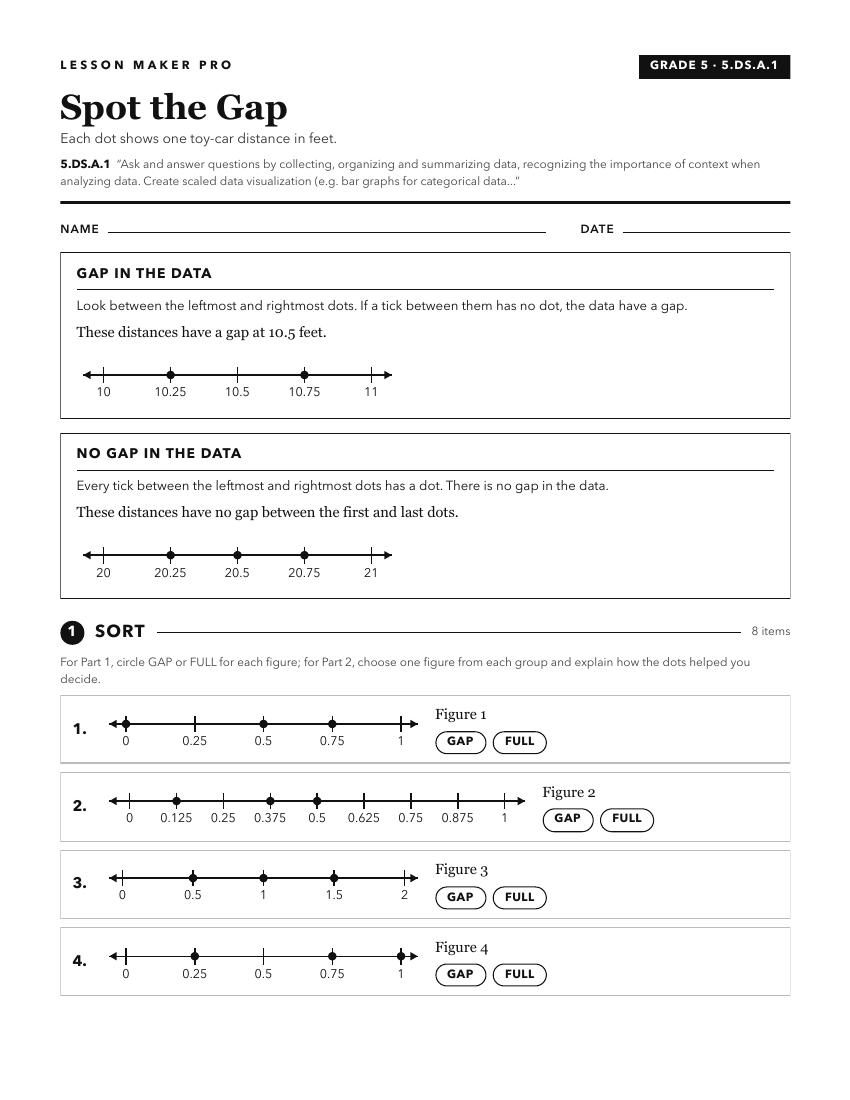
A ready-to-print activity worksheet aligned to 5.DS.A.1, with an answer key for the teacher on its own page. No account needed.
PDF, US Letter, prints cleanly in black and white.
Download the worksheetKeep exploring
Related Standards
Turn this cluster into a lesson
Grade, subject, topic, and the complete cluster are prefilled. Create one free, no account needed.
Also for this cluster:Make a WorksheetMake a QuizMake a Sub Lesson