Maryland Math 1.DS.A.1.d
The Standard
- 1.DS.A.1
- Ask and answer questions by collecting, organizing and summarizing data.
Summarize the data presented in tally charts using “most,” “least,” “greater than,” “less than,” and “equal to”.
Maryland College and Career Ready Standards for Mathematics (2025) · REPRESENT AND INTERPRET DATA.
Teacher's field guide
What This Standard Means
What Students Need to Do
- Students count the tally marks for each category. They name which categories have the most and least, then compare two counts using greater than, less than, or equal to.
What Mastery Looks Like
- A student counts each tally mark, including the crossed mark in a group of five. They spot ties and use the comparison words correctly while pointing to the tallies.
Common Misconceptions
- Some students count a crossed fifth tally as two marks or skip it. Others miss ties or reverse greater than and less than when comparing counts.
How to Assess It
- Show this tally chart: cats ||||, dogs ||, fish ||||, birds |. Ask, 'Which have the most and least votes, which have equal votes, and are dogs greater than or less than cats?'
Lesson moves
Ways to Teach It
Give each pair 4 red, 2 blue, and 4 yellow cubes; have them tally each color and identify the most, least, and equal counts.
Post this tally chart: red |||, blue ||||, green |||; ask which colors have equal votes and how students know.
Play Tally Match: match a chart card showing cats |||| and dogs || with sentence cards saying 'cats greater than dogs' and 'dogs less than cats.'
Survey classmates on how they got to school, tally bus, car, and walking responses, then compare the walking and car counts.
Free download
Printable 1.DS.A.1.d Worksheet
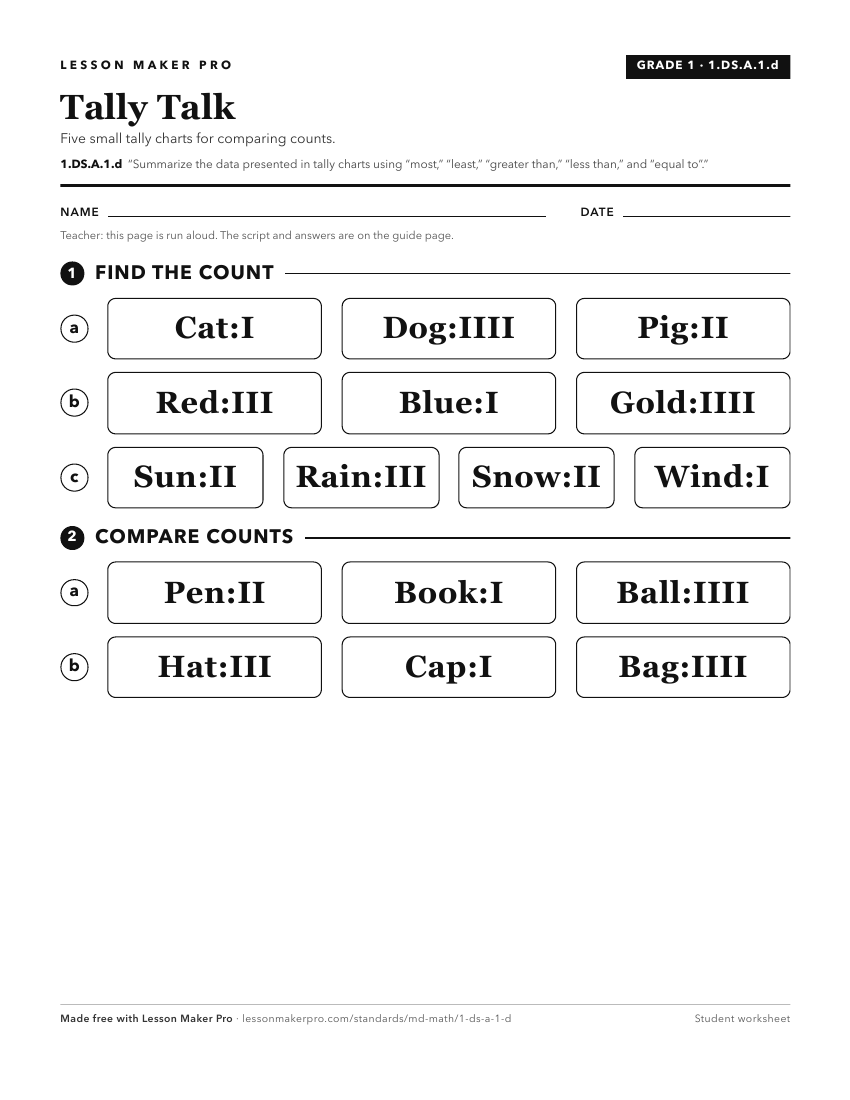
A ready-to-print activity worksheet aligned to 1.DS.A.1.d, with an answer key for the teacher on its own page. No account needed.
PDF, US Letter, prints cleanly in black and white.
Download the worksheetKeep exploring
Related Standards
- 2.DS.A.1.d
Summarize the data presented in data visualizations using “most,” “least,” “greater than,” “less than,” and “equal to” and determine what questions can be answe...
- 1.DS.A.1.c
Represent data by creating tally charts and picture graphs.
- K.NOS.C.10
Compare two quantities within 20 using greater than, equal to, or less than, with objects, location on number paths, and written numerals.
- 5.DS.A.1.b
Summarize data presented in scaled visualizations (e.g. bar graphs, circle graphs, line plots, line graphs) by identifying the mode, the range, and any gaps in ...
Turn this exact standard into a lesson
Grade, subject, topic, and the complete standard are prefilled. Create one free, no account needed.
Also for this standard:Make a WorksheetMake a QuizMake a Sub Lesson