Maryland Math 2.DS.A.1.d
The Standard
- 2.DS.A.1
- Ask and answer questions by collecting, organizing and summarizing data.
Summarize the data presented in data visualizations using “most,” “least,” “greater than,” “less than,” and “equal to” and determine what questions can be answered with a given data set.
Maryland College and Career Ready Standards for Mathematics (2025) · REPRESENT AND INTERPRET DATA.
Teacher's field guide
What This Standard Means
What Students Need to Do
- Students read graphs to compare how many are in each group. They use most, least, greater than, less than, and equal to. They decide which questions the graph can answer.
What Mastery Looks Like
- A student correctly names the largest and smallest groups, compares two counts, and spots a tie. They can answer a count question and explain why the graph cannot tell why people made their choices.
Common Misconceptions
- Students may pick the group they like best instead of the group with the highest count, or miss a tie. They may think a graph of votes shows why people voted that way.
How to Assess It
- Exit ticket: Show a fruit-vote bar graph with apples 6, bananas 4, pears 4, and oranges 2. Ask students to name the most, least, an equal pair, and one question the graph cannot answer.
Lesson moves
Ways to Teach It
Have students place sticky notes above fruit labels to make a class graph, then compare two totals using greater than, less than, or equal to.
Display a pet graph with 8 dogs, 5 cats, and 2 fish; ask, 'Which has the most votes? Can we tell why?'
Play true or false with a graph showing 5 red, 3 blue, and 5 green tiles; read comparison cards aloud.
Post yesterday's cafeteria lunch-count chart; ask which meal had the fewest orders and whether the chart shows which meal tasted best.
Free download
Printable 2.DS.A.1.d Worksheet
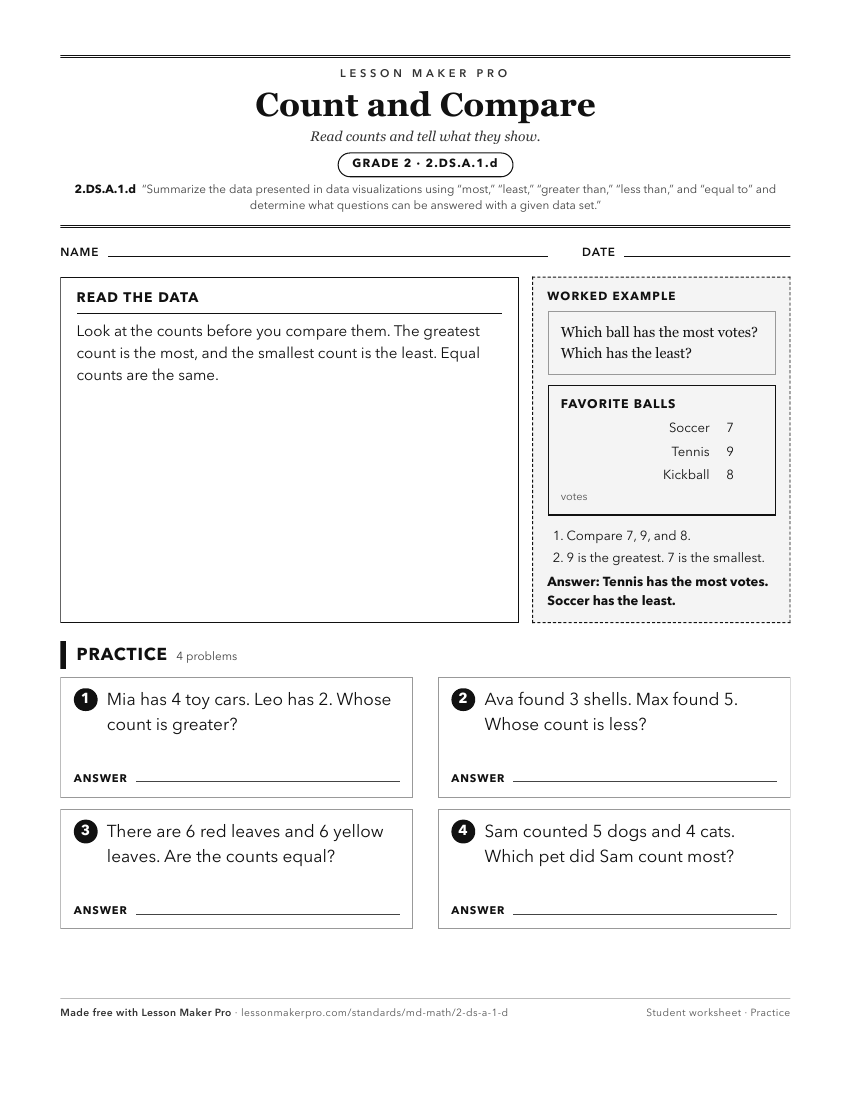
A ready-to-print activity worksheet aligned to 2.DS.A.1.d, with an answer key for the teacher on its own page. No account needed.
PDF, US Letter, prints cleanly in black and white.
Download the worksheetKeep exploring
Related Standards
- 4.DS.A.1.c
Compare and contrast different data visualizations of the same data by varying attributes (e.g., reordering bars, changing the scale) and explain how changing t...
- 1.DS.A.1.d
Summarize the data presented in tally charts using “most,” “least,” “greater than,” “less than,” and “equal to”.
- 4.DS.A.1.b
Summarize data presented in scaled data visualizations (e.g. bar graphs, line plots) and draw conclusions about the data.
- 5.DS.A.1.b
Summarize data presented in scaled visualizations (e.g. bar graphs, circle graphs, line plots, line graphs) by identifying the mode, the range, and any gaps in ...
Turn this exact standard into a lesson
Grade, subject, topic, and the complete standard are prefilled. Create one free, no account needed.
Also for this standard:Make a WorksheetMake a QuizMake a Sub Lesson