Maryland Math 4.DS.A.1.c
The Standard
- 4.DS.A.1
- Ask and answer questions by collecting, organizing and summarizing data, recognizing the importance of context when analyzing data.
Compare and contrast different data visualizations of the same data by varying attributes (e.g., reordering bars, changing the scale) and explain how changing the attributes affects the interpretation.
Maryland College and Career Ready Standards for Mathematics (2025) · REPRESENT AND INTERPRET DATA.
Teacher's field guide
What This Standard Means
What Students Need to Do
- Students make or compare bar graphs of the same counts. They change the bar order or number scale, then explain how each change affects what a reader notices.
What Mastery Looks Like
- A student can find the same count for each category in both graphs. They can explain why a scale ending at 20 makes gaps look bigger than a scale ending at 40, even though the counts did not change.
Common Misconceptions
- Students may think a bar that looks taller in one graph represents more votes, even when both graphs show the same count. They may also think moving a bar changes its count or that bar order always shows a time sequence.
How to Assess It
- Show two bar graphs of soccer 6, tag 12, and drawing 18. Reverse the bar order and change the scale from 0 to 20 to 0 to 40, then ask which graph makes the lead look bigger and whether any counts changed.
Lesson moves
Ways to Teach It
Give pairs counters for 6, 12, and 18 snack votes; have them build three bar stacks, then swap the stacks' positions.
Show two graphs of the same snack votes with scales ending at 20 and 40; ask, "Which makes the lead look bigger? Why?"
Play chart match with printed graphs of the same vote counts; students pair graphs despite different bar orders and scales.
Post two mock cafeteria poll flyers with the same fruit counts but different scales; students choose which flyer shows the differences more clearly.
Free download
Printable 4.DS.A.1.c Worksheet
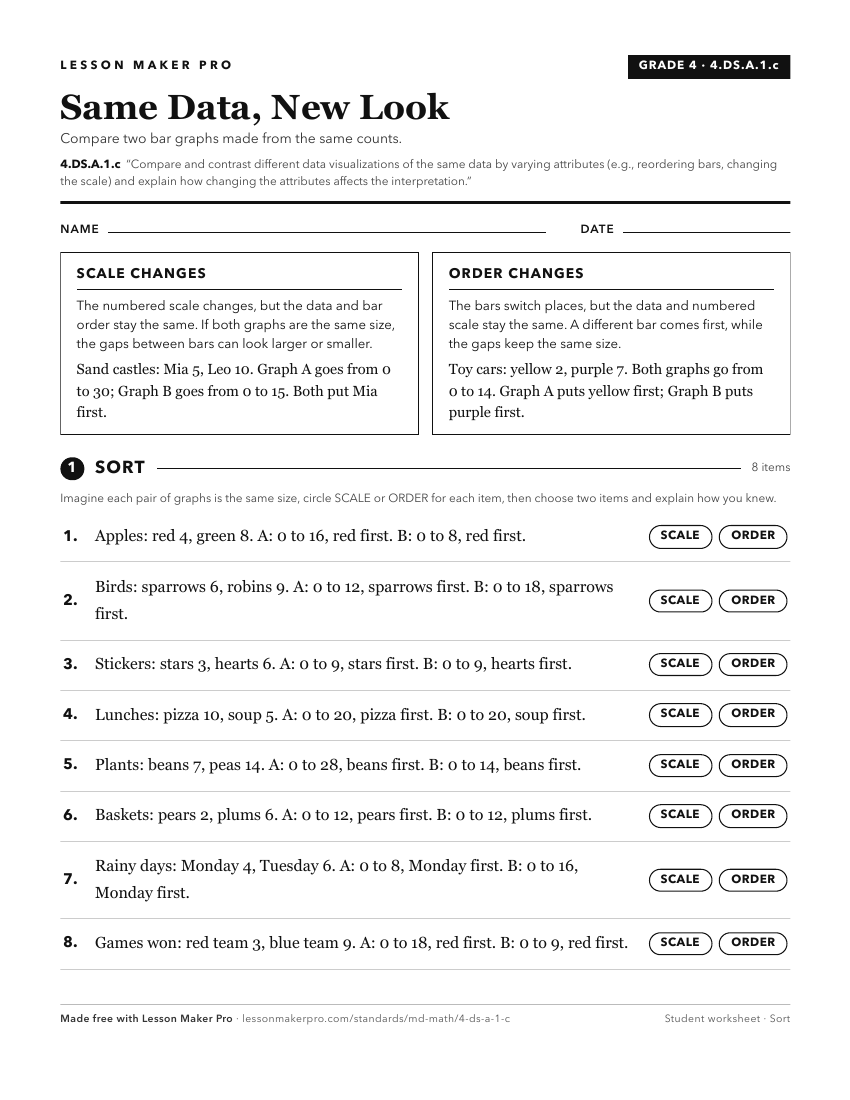
A ready-to-print activity worksheet aligned to 4.DS.A.1.c, with an answer key for the teacher on its own page. No account needed.
PDF, US Letter, prints cleanly in black and white.
Download the worksheetKeep exploring
Related Standards
- 4.DS.A.1.b
Summarize data presented in scaled data visualizations (e.g. bar graphs, line plots) and draw conclusions about the data.
- 5.DS.A.1.b
Summarize data presented in scaled visualizations (e.g. bar graphs, circle graphs, line plots, line graphs) by identifying the mode, the range, and any gaps in ...
- 5.DS.A.1.a
Create scaled data visualization (e.g. bar graphs for categorical data; line plots with fraction units of halves, fourths, and eighths for numerical data) to di...
- 4.DS.A.1.a
Create scaled data visualization (e.g. bar graphs for categorical data; line plots with fraction units of halves, fourths, and eighths for numerical data) to di...
Turn this exact standard into a lesson
Grade, subject, topic, and the complete standard are prefilled. Create one free, no account needed.
Also for this standard:Make a WorksheetMake a QuizMake a Sub Lesson