Indiana Science HS-PSII-9.4
The Standard
Describe the slope of the graphical representation of the kinetic energy of a photoelectron vs. frequency in terms of Planck’s constant.
Indiana Academic Standards for Science (2023) · Particle and Wave Nature of Light
Teacher's field guide
What This Standard Means
What Students Need to Do
- Students read a graph of electron kinetic energy against light frequency. They find the slope using two points above the cutoff frequency and connect it to Planck’s constant.
What Mastery Looks Like
- Students calculate the slope as about 6.63 × 10⁻³⁴ J·s. They explain that different metals can have different cutoff frequencies but the same slope.
Common Misconceptions
- Students may mistake the slope for the metal’s work function or think it changes with the metal. Some use light intensity instead of frequency, or plot energy values below the cutoff, where no electrons are emitted.
How to Assess It
- Exit ticket: Electron energies are 1.00 × 10⁻¹⁹ J at 8 × 10¹⁴ Hz and 2.32 × 10⁻¹⁹ J at 10 × 10¹⁴ Hz. Find the slope and name the constant it represents.
Lesson moves
Ways to Teach It
Plot frequency-energy pairs (8, 1.00), (9, 1.66), and (10, 2.32) on graph paper, using 10¹⁴ Hz and 10⁻¹⁹ J; find the slope.
Show two parallel energy-frequency lines for different metals; ask students why their cutoff frequencies differ but their slopes match.
Give pairs cards with changes in frequency and kinetic energy; have them match cards whose ratio is 6.63 × 10⁻³⁴ J·s.
Use the class graph as a photocell calibration chart; ask students to predict electron energy at 9.5 × 10¹⁴ Hz.
Free download
Printable HS-PSII-9.4 Worksheet
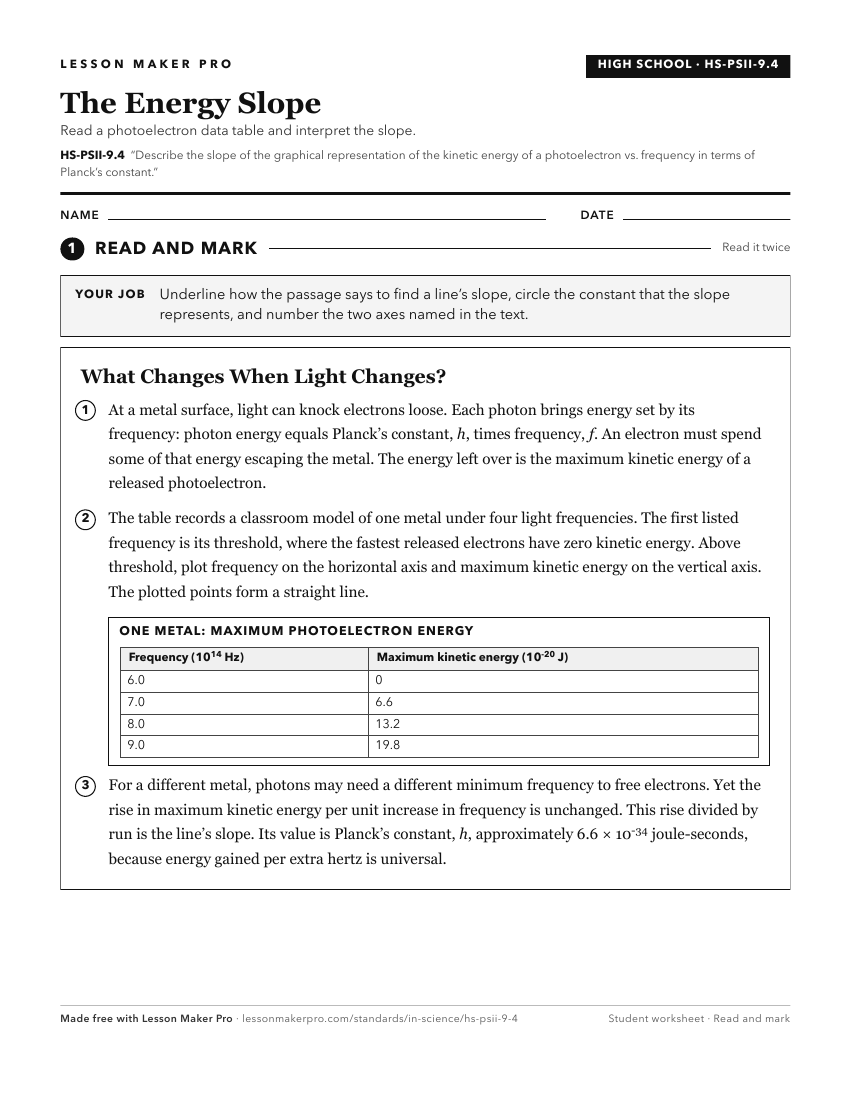
A ready-to-print activity worksheet aligned to HS-PSII-9.4, with an answer key for the teacher on its own page. No account needed.
PDF, US Letter, prints cleanly in black and white.
Download the worksheetKeep exploring
Related Standards
- HS-PSII-9.3
Develop graphical and mathematical representations that describe the relationship between the frequency of a photon and the kinetic energy of an electron emitte...
- HS-PSII-9.1
Develop the relationship among frequency, wavelength, and energy for electromagnetic waves across the entire spectrum.
- HS-PSII-5.3
Describe the slope of the graphical representation of current vs. voltage or voltage vs. current in terms of the resistance of the device.
- HS-PSII-2.5
Describe the slope of the graphical representation of pressure vs. the product of: the number of particles, temperature of the gas, and inverse of the volume of...
Turn this exact standard into a lesson
Grade, subject, topic, and the complete standard are prefilled. Create one free, no account needed.
Also for this standard:Make a WorksheetMake a QuizMake a Sub Lesson