Georgia S8P4.e
The Standard
- S8P4
- Obtain, evaluate, and communicate information to support the claim that electromagnetic (light) waves behave differently than mechanical (sound) waves.
Analyze and interpret data to predict patterns in the relationship between density of media and wave behavior (i.e., speed).
Georgia Standards of Excellence for Science · Obtain, evaluate, and communicate information to support the claim that electromagnetic (light) waves behave differently than mechanical (sound) waves.
Teacher's field guide
What This Standard Means
What Students Need to Do
- Students organize density and speed data for several media in tables or graphs. They identify how sound and light trends differ, then use those trends to predict speed in a new medium.
What Mastery Looks Like
- A student graphs density against speed with labeled axes, describes each trend, and predicts an untested value or ranking. The student cites data and recognizes that density alone does not determine speed in every material.
Common Misconceptions
- Students often think all waves move faster in denser matter. They may confuse material density with optical density or claim density alone determines sound speed. Some also think light needs matter because sound does.
How to Assess It
- Give students these density, sound speed, and light speed data: air, 0.0012, 343, 300,000; water, 1.0, 1,480, 225,000; glass, 2.5, 5,000, 200,000. Ask them to state each pattern and predict relative speeds in a medium with density between water and glass.
Lesson moves
Ways to Teach It
Send pulses through equal-length light and heavy ropes under the same hanging weight, film them in slow motion, and compare travel times.
Ask students to write: Why can sound speed up while light slows down when each enters a denser material?
Play Data Match: teams pair medium cards with density and speed cards, then defend each sound and light match using the pattern.
Compare sonar through seawater with fiber-optic signals, and have students explain how each medium affects signal speed.
Free download
Printable S8P4.e Worksheet
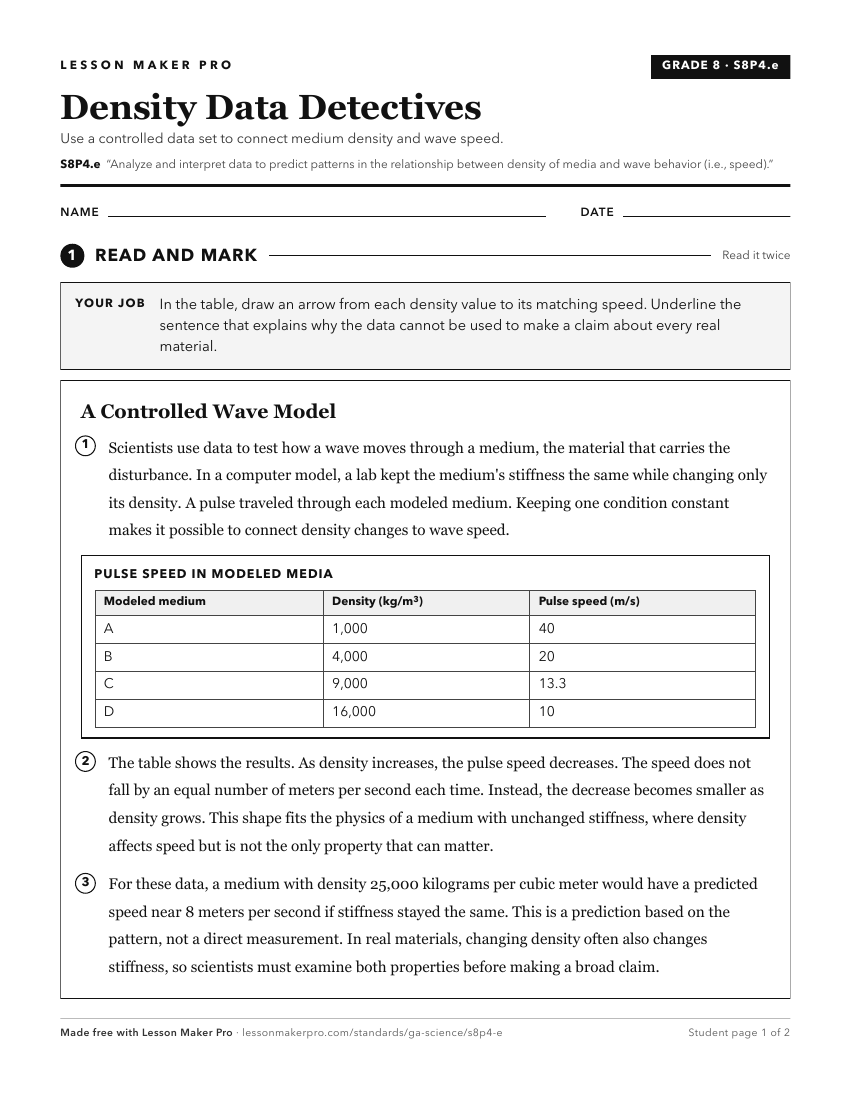
A ready-to-print activity worksheet aligned to S8P4.e, with an answer key for the teacher on its own page. No account needed.
PDF, US Letter, prints cleanly in black and white.
Download the worksheetKeep exploring
Related Standards
- S8P3.a
Analyze and interpret data to identify patterns in the relationships between speed and distance, and velocity and acceleration.
- S6E3.d
Analyze and interpret data to create graphic representations of the causes and effects of waves, currents, and tides in Earth's systems.
- S8P4.d
Develop and use a model to compare and contrast how light and sound waves are reflected, refracted, absorbed, diffracted or transmitted through various material...
- S8P4.f
Develop and use a model (e.g., simulations, graphs, illustrations) to predict and describe the relationships between wave properties (e.g., frequency, amplitude...
Turn this exact standard into a lesson
Grade, subject, topic, and the complete standard are prefilled. Create one free, no account needed.
Also for this standard:Make a WorksheetMake a QuizMake a Sub Lesson