Georgia S6E3.d
The Standard
- S6E3
- Obtain, evaluate, and communicate information to recognize the significant role of water in Earth processes.
Analyze and interpret data to create graphic representations of the causes and effects of waves, currents, and tides in Earth's systems.
Georgia Standards of Excellence for Science · Obtain, evaluate, and communicate information to recognize the significant role of water in Earth processes.
Teacher's field guide
What This Standard Means
What Students Need to Do
- Students analyze tables, maps, and graphs showing wave height, current direction, tide height, and shoreline change. They create visual displays and use data patterns to connect causes with effects in Earth’s systems.
What Mastery Looks Like
- A student selects a suitable graph, labels axes and units, and plots data accurately. They use trends to explain how wind, water density, and gravity affect water movement without claiming more than the data show.
Common Misconceptions
- Students often treat waves, currents, and tides as the same motion, or assume waves carry water forward with the wave energy. They may say wind causes tides, or that the Moon acts alone, ignoring the Sun’s smaller effect. Graph errors include reversing axes, omitting units, and describing a trend without linking it to a cause or effect.
How to Assess It
- Give students three four-row tables: wind speed and wave height, temperature difference and current speed, and moon phase and tidal range. Ask them to graph one table, label the cause and effect, and write one pattern supported by the data.
Lesson moves
Ways to Teach It
Use a shallow tray and fan to generate waves, measure wave height at three fan speeds, then graph the results.
Study a tide height graph beside a moon phase calendar, then write which pattern supports a claim about tidal causes.
Play a card sort matching data displays with wave, current, or tide causes and effects, then justify each match.
Use NOAA buoy, current, and tide data to choose the safest time and route for a small boat trip.
Free download
Printable S6E3.d Worksheet
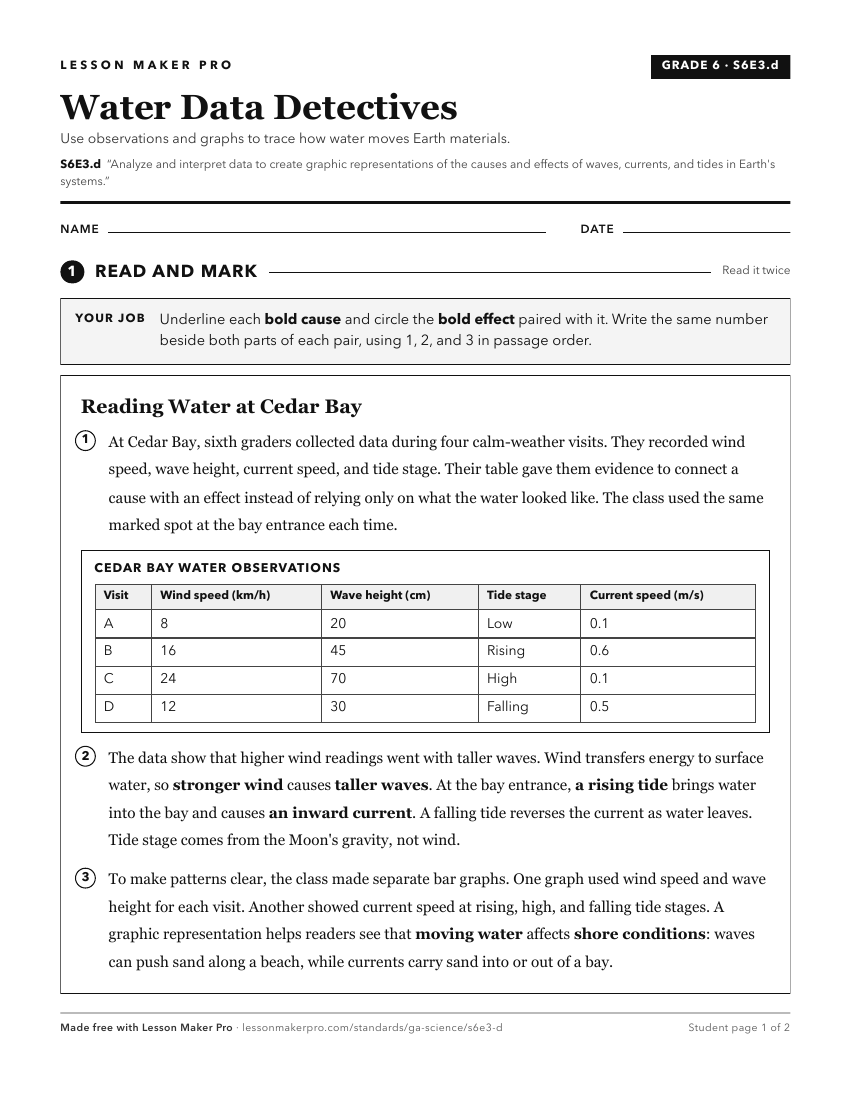
A ready-to-print activity worksheet aligned to S6E3.d, with an answer key for the teacher on its own page. No account needed.
PDF, US Letter, prints cleanly in black and white.
Download the worksheetKeep exploring
Related Standards
- S6E3.c
Ask questions to identify and communicate, using graphs and maps, the composition, location, and subsurface topography of the world's oceans.
- S2E2
Obtain, evaluate, and communicate information to develop an understanding of the patterns of the sun and the moon and the sun's effect on Earth.
- S6E2.c
Analyze and interpret data to relate the tilt of the Earth to the distribution of sunlight throughout the year and its effect on seasons.
- S6E4.e
Analyze and interpret weather data to explain the effects of moisture evaporating from the ocean on weather patterns and weather events such as hurricanes.
Turn this exact standard into a lesson
Grade, subject, topic, and the complete standard are prefilled. Create one free, no account needed.
Also for this standard:Make a WorksheetMake a QuizMake a Sub Lesson