Georgia S6E2.c
The Standard
- S6E2
- Obtain, evaluate, and communicate information about the effects of the relative positions of the sun, Earth, and moon.
Analyze and interpret data to relate the tilt of the Earth to the distribution of sunlight throughout the year and its effect on seasons.
Georgia Standards of Excellence for Science · Obtain, evaluate, and communicate information about the effects of the relative positions of the sun, Earth, and moon.
Teacher's field guide
What This Standard Means
What Students Need to Do
- Students read graphs, tables, and models showing daylight length and sunlight angle during the year. They use the data to explain seasonal changes in both hemispheres.
What Mastery Looks Like
- Students identify when each hemisphere receives more direct sunlight and longer daylight. They support claims about seasons with specific evidence from a graph, table, or model.
Common Misconceptions
- Students often think seasons happen because Earth moves closer to or farther from the sun. They may think both hemispheres have the same season. Some confuse longer daylight with Earth rotating more slowly.
How to Assess It
- Give students a graph of monthly daylight hours in Atlanta. Ask them to identify one likely summer month and explain their choice using two details from the graph.
Lesson moves
Ways to Teach It
Use a lamp and tilted globe to compare beam angle and hours of light at marked northern and southern locations.
Ask students to write why June brings summer to Georgia but winter to Australia, using sunlight angle and daylight length.
Give teams season cards, hemisphere cards, and sunlight data cards to match, then require a data-based explanation for each set.
Compare monthly daylight data for Atlanta and Sydney, then connect the patterns to clothing, sports schedules, or heating and cooling use.
Free download
Printable S6E2.c Worksheet
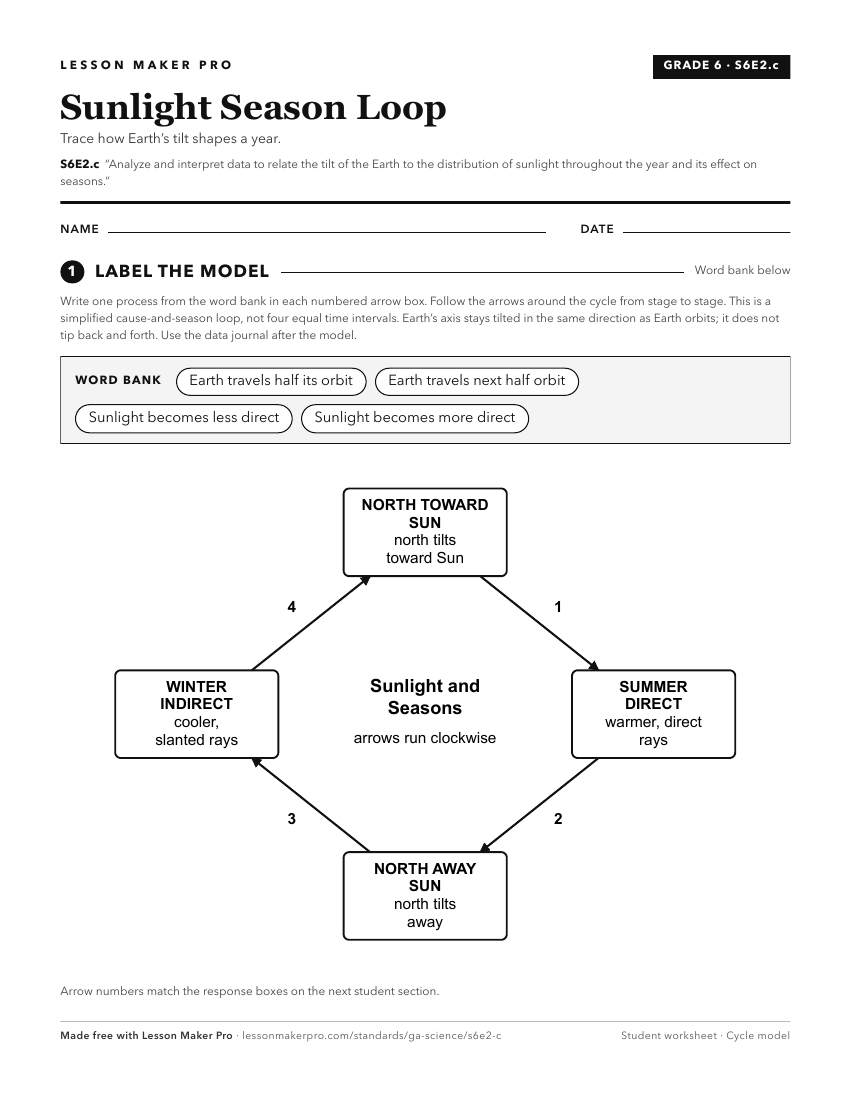
A ready-to-print activity worksheet aligned to S6E2.c, with an answer key for the teacher on its own page. No account needed.
PDF, US Letter, prints cleanly in black and white.
Download the worksheetKeep exploring
Related Standards
- S4E2.c
Construct an explanation of how the Earth's orbit, with its consistent tilt, affects seasonal changes.
- S6E3.d
Analyze and interpret data to create graphic representations of the causes and effects of waves, currents, and tides in Earth's systems.
- S1E1.d
Analyze data to identify seasonal patterns of change.
- S2E2.c
Represent data in tables and/or graphs of the length of the day and night to recognize the change in seasons.
Turn this exact standard into a lesson
Grade, subject, topic, and the complete standard are prefilled. Create one free, no account needed.
Also for this standard:Make a WorksheetMake a QuizMake a Sub Lesson