Florida SS.7.G.4.2
The Standard
- SS.7.G.4
- Understand the characteristics, distribution, and migration of human populations.
Use maps and other geographic tools to examine the importance of demographics within political divisions of the United States.
Florida Next Generation Sunshine State Standards for Social Studies
Teacher's field guide
What This Standard Means
What Students Need to Do
- Students read demographic maps, legends, tables, and census data for states, counties, and districts. They compare population traits and explain how those patterns may affect representation, services, or policy.
What Mastery Looks Like
- Students accurately identify patterns using map evidence and demographic data. They compare political areas, distinguish totals from percentages, and support a conclusion with specific figures.
Common Misconceptions
- Students may assume darker shading always means more people without checking the legend. They may confuse population totals with percentages or treat state and county boundaries as demographic boundaries.
How to Assess It
- Give students a county map showing the percentage of residents over age 65. Ask them to name one county that may need more senior services and cite map evidence.
Lesson moves
Ways to Teach It
Give pairs printed county maps and transparent demographic overlays, then have them mark three patterns that cross political boundaries.
Ask students to write which demographic measure would best help a mayor plan services, then defend their choice with an example.
Run a map clue relay where teams identify a state or county from demographic data, legends, and boundary clues.
Use Census QuickFacts to compare two nearby counties and propose one public service each county may need most.
Free download
Printable SS.7.G.4.2 Worksheet
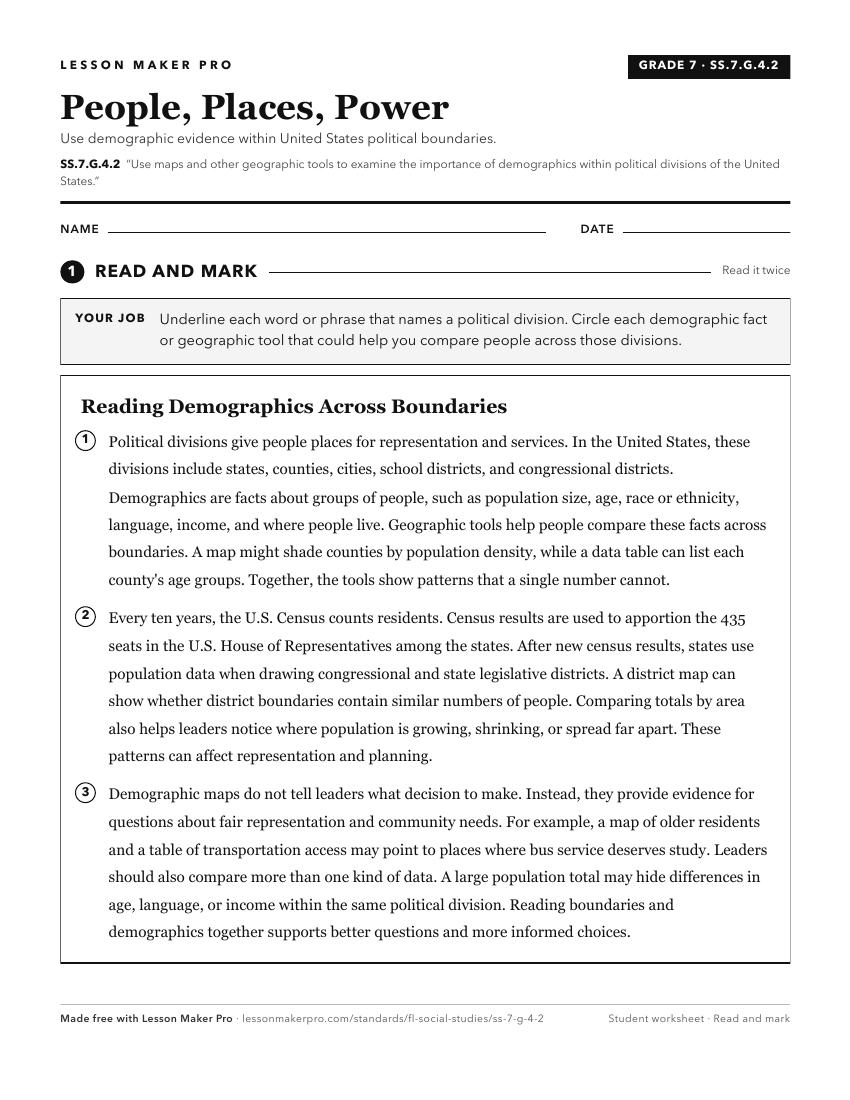
A ready-to-print activity worksheet aligned to SS.7.G.4.2, with an answer key for the teacher on its own page. No account needed.
PDF, US Letter, prints cleanly in black and white.
Download the worksheetKeep exploring
Related Standards
- SS.8.G.6.1
Use appropriate maps and other graphic representations to analyze geographic problems and changes over time throughout American history.
- SS.8.G.4.6
Use political maps to describe changes in boundaries and governance throughout American history.
- SS.8.G.1.1
Use maps to explain physical and cultural attributes of major regions throughout American history.
- SS.8.G.2.3
Use geographic terms and tools to analyze case studies of how selected regions of the United States have changed over time.
Turn this exact standard into a lesson
Grade, subject, topic, and the complete standard are prefilled. Create one free, no account needed.
Also for this standard:Make a WorksheetMake a QuizMake a Sub Lesson