CCSS.
Standard Cluster
Develop understanding of statistical variability.
Common Core State Standards for Mathematics
Cluster contents
Standards in This Cluster
CCSS.Math.Content.6.SP.A is a cluster heading. These are the individual standards under it.
- CCSS.Math.Content.6.SP.A.1
Recognize a statistical question as one that anticipates variability in the data related to the question and accounts for it in the answers.
- CCSS.Math.Content.6.SP.A.2
Understand that a set of data collected to answer a statistical question has a distribution which can be described by its center, spread, and overall shape.
- CCSS.Math.Content.6.SP.A.3
Recognize that a measure of center for a numerical data set summarizes all of its values with a single number, while a measure of variation describes how its va...
Teacher's field guide
What This Cluster Means
What Students Need to Do
- Students decide whether a question expects varied numerical answers. They collect or examine data and describe the distribution using its center, spread, and overall shape.
What Mastery Looks Like
- Students can explain why a question expects answers that vary. Given a table, dot plot, or histogram, they can describe a typical value, overall spread, clusters, gaps, and unusual values.
Common Misconceptions
- Students may think any question involving numbers is statistical. They may also report only the mean or median and ignore spread, clusters, gaps, or unusual values.
How to Assess It
- Give students the data 4, 5, 5, 6, 6, 6, 7, 9. Ask them to name a statistical question that could produce it, then describe its center, spread, and shape.
Lesson moves
Ways to Teach It
Have students measure their pencil lengths, make a class dot plot, and describe the center, spread, clusters, gaps, and unusual values.
Discuss: Why is “How tall am I?” not statistical, while “How tall are students in our class?” is statistical?
Play a card sort where teams classify question cards as statistical or nonstatistical and defend each choice.
Use one month of local temperatures to describe a typical temperature, the range, clusters, gaps, and unusually warm or cold days.
Free download
Printable 6.SP.A Worksheet
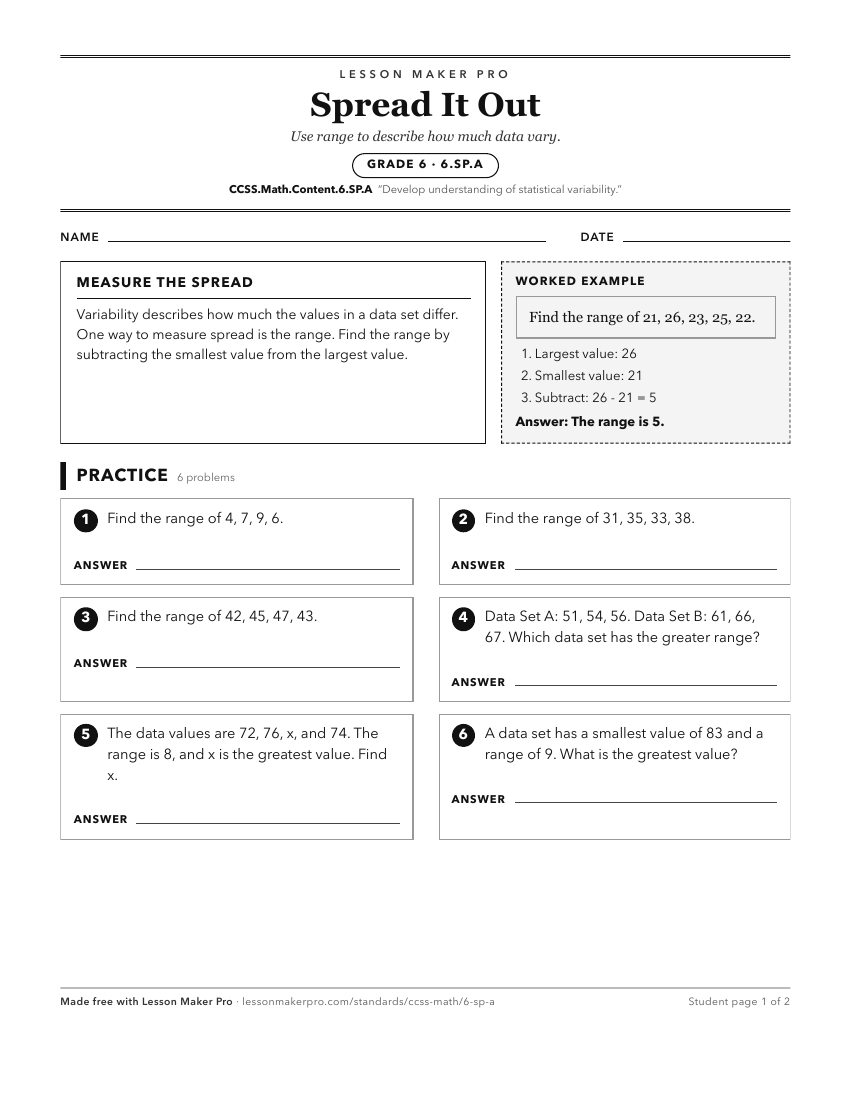
A ready-to-print activity worksheet aligned to CCSS.Math.Content.6.SP.A, with an answer key for the teacher on its own page. No account needed.
PDF, US Letter, prints cleanly in black and white.
Download the worksheetKeep exploring
Related Standards
Turn this cluster into a lesson
Grade, subject, topic, and the complete cluster are prefilled. Create one free, no account needed.
Also for this cluster:Make a WorksheetMake a QuizMake a Sub Lesson