Alabama Social Studies SS24.HG.1
The Standard
Differentiate among types of charts, graphs, infographics, and maps, and explain how different types of these illustrate data and trends.
2024 Alabama Course of Study: Social Studies
Teacher's field guide
What This Standard Means
What Students Need to Do
- Students tell apart bar charts, line graphs, infographics, reference maps, and maps that show data. They explain which displays show comparisons, change over time, or patterns by place.
What Mastery Looks Like
- A student can use a bar chart and a shaded county map to find the highest value and where it occurs. They check labels and legends before describing a pattern. They can explain why a line graph works well for year-to-year change.
Common Misconceptions
- Students may read darker map colors as larger totals when the legend shows percentages. They may use a line graph for unrelated categories or assume an infographic's headline tells the whole story.
How to Assess It
- Show a bar chart, line graph, shaded map, and infographic about unemployment. Ask students to name each display and write one pattern each makes easy to see.
Lesson moves
Ways to Teach It
Give pairs county unemployment rates and blank county maps; have them shade the maps using a legend, then make bar charts of the same rates.
Show yearly population data in a bar chart and line graph; ask, "Which makes the trend easier to see, and why?"
Post a bar chart, line graph, infographic, and shaded map; read questions and have students move to the display that best answers each one.
Print a local weather map and monthly rainfall graph; have students explain which shows location and which shows a trend.
Free download
Printable SS24.HG.1 Worksheet
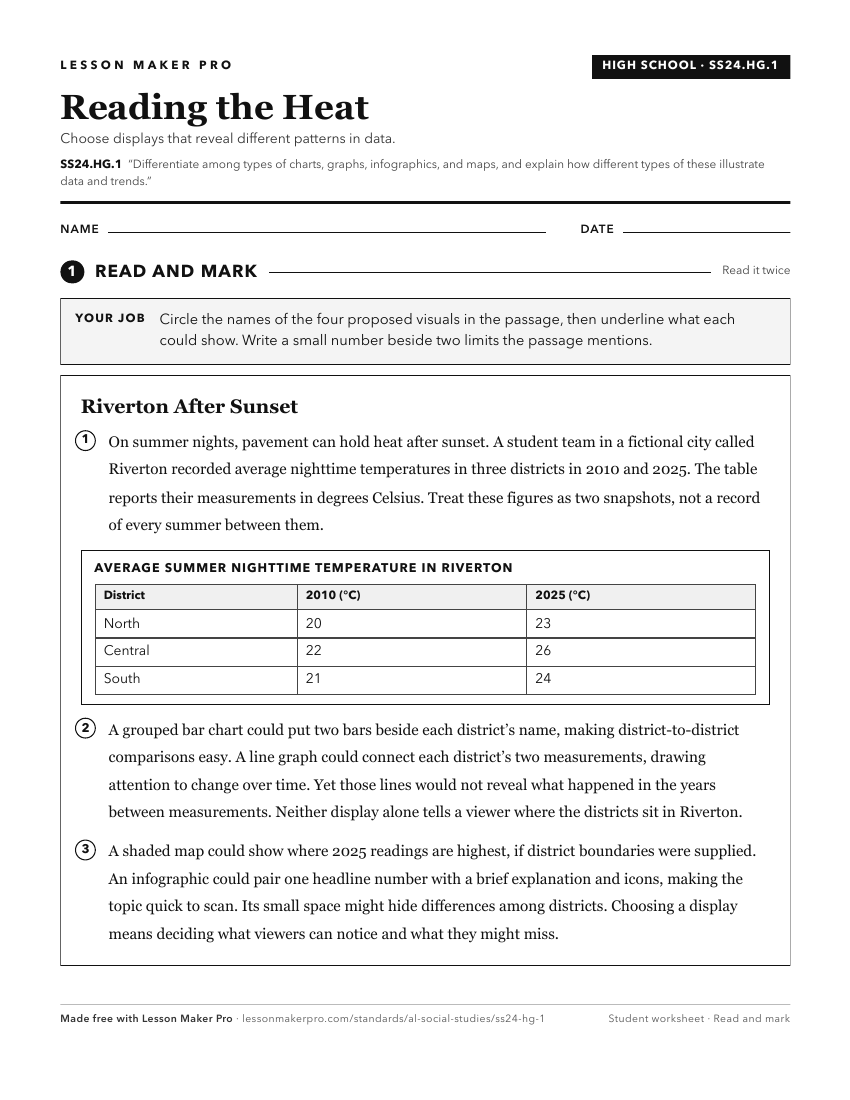
A ready-to-print activity worksheet aligned to SS24.HG.1, with an answer key for the teacher on its own page. No account needed.
PDF, US Letter, prints cleanly in black and white.
Download the worksheetKeep exploring
Related Standards
- SS24.2.8
Differentiate between the features of a physical map and a political map, and explain how these features contribute to the map’s purpose.
- SS24.1.9
Differentiate among landforms, bodies of water, and other physical features on maps, globes, and satellite and digital images.
- SS24.7.4a
Differentiate among primary, secondary, and tertiary sources in how they are used to study both history and geography.
- SS24.7.1c
Utilize maps to explain relationships among people and places, including governmental alliances, immigration patterns, and trade patterns.
Turn this exact standard into a lesson
Grade, subject, topic, and the complete standard are prefilled. Create one free, no account needed.
Also for this standard:Make a WorksheetMake a QuizMake a Sub Lesson