Alabama Science ES.3
Standard Cluster
Construct an explanation of how biotic and abiotic factors affect biodiversity and populations in ecosystems. a. Support a claim that biodiversity is a natural resource which fosters ecosystem resilience, including the role of keystone, invasive, native, endemic, and indicator species. b. Analyze and interpret data collected through geographic research and field investigations to describe Alabama’s biodiversity by region.
2023 Alabama Course of Study: Science · Unity and Diversity
Cluster contents
Standards in This Cluster
ES.3 is a cluster heading. These are the individual standards under it.
- ES.3.a
Support a claim that biodiversity is a natural resource which fosters ecosystem resilience, including the role of keystone, invasive, native, endemic, and indic...
- ES.3.b
Analyze and interpret data collected through geographic research and field investigations to describe Alabama’s biodiversity by region.
Teacher's field guide
What This Cluster Means
What Students Need to Do
- Students explain how living things, water, soil, and temperature affect population sizes and the mix of species. They use field counts and maps to compare Alabama regions. They explain how different species can help an ecosystem recover after change.
What Mastery Looks Like
- Students use data from two Alabama regions to compare the number of species, not just the number of organisms. They connect differences to conditions such as rainfall or soil. They explain how gopher tortoises support other species, while kudzu can crowd them out.
Common Misconceptions
- Students may count many individuals of one species as high biodiversity. They may call every nonnative species invasive or miss that an endemic species is also native. They may assume more species make an ecosystem safe from any disturbance.
How to Assess It
- Show two Alabama sites with plant counts, soil moisture, and shade readings. Ask students to compare biodiversity and name one living and one nonliving factor that could explain the difference.
Lesson moves
Ways to Teach It
Lay two one-meter string squares in sun and shade; count plant species, measure soil moisture, and graph the results.
Discuss: Why might a longleaf pine forest with gopher tortoises recover better after fire than one without them? Name burrow users.
Match Alabama species fact cards to roles, allowing overlaps: gopher tortoise, kudzu, longleaf pine, Red Hills salamander, and mayfly nymph.
Use an Alabama ecoregion map and iNaturalist records to compare Coastal Plain and Cumberland Plateau species, then flag uneven survey effort.
Free download
Printable ES.3 Worksheet
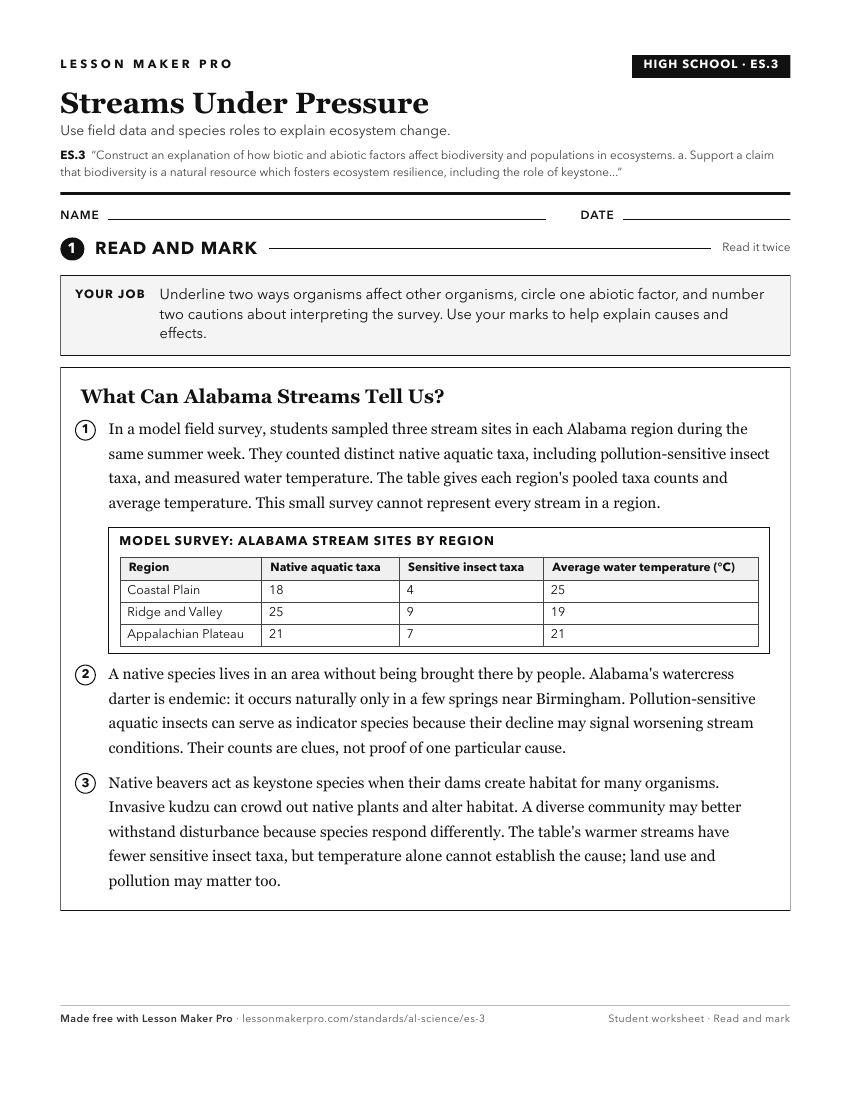
A ready-to-print activity worksheet aligned to ES.3, with an answer key for the teacher on its own page. No account needed.
PDF, US Letter, prints cleanly in black and white.
Download the worksheetKeep exploring
Related Standards
- 7.5
Construct an explanation of how the cycling of matter between abiotic and biotic parts of ecosystems demonstrates the flow of energy and the conservation of mat...
- BIO.8
Construct an evidence-based explanation of how density-dependent and density-independent factors affect population growth.
- 7.7
Analyze and interpret data to explain how density-independent and density-dependent limiting factors in an ecosystem can lead to shifts in populations.
Turn this cluster into a lesson
Grade, subject, topic, and the complete cluster are prefilled. Create one free, no account needed.
Also for this cluster:Make a WorksheetMake a QuizMake a Sub Lesson