Alabama Science 6.10.c
The Standard
- 6.10
- Use observations and data from investigations to demonstrate how the sun, air, land, and water affect Earth’s climate.
Construct an explanation of how altitude, geothermal activity, and oceanic distribution of heat produce typical regional climate patterns.
2023 Alabama Course of Study: Science
Teacher's field guide
What This Standard Means
What Students Need to Do
- Students use maps and temperature data to explain why regions have different climates. They connect higher altitude with cooler air, ocean currents with warmer or cooler coasts, and geothermal activity with heat near the ground.
What Mastery Looks Like
- A student can compare long-term temperature data for two places and identify which is cooler. Using elevation and ocean-current evidence, they explain how these factors could contribute to the pattern without claiming they are the only causes. They distinguish coastal warming by ocean heat from a hot spring's nearby warming.
Common Misconceptions
- Students may think mountains are warmer because they are closer to the sun. They may assume all ocean currents are warm, or that a hot spring heats an entire region.
How to Assess It
- Exit ticket: Use these illustrative climate data for two fictional towns in the same region: Town A, high in the mountains near a hot spring, has a 30-year mean annual temperature of 8°C. Town B, at sea level beside a warm ocean current, has a 30-year mean annual temperature of 14°C. Which town is cooler in these data? Explain how altitude and ocean heat could contribute to the difference, and why the hot spring may not change Town A's overall climate.
Lesson moves
Ways to Teach It
Stack three books as a mountain; place cards marked 20°C, 17°C, and 14°C from base to top.
Ask students to write why a coastal town might have milder winters than a mountain town near a hot spring.
Give pairs cards for fictional places at comparable latitudes, showing altitude, nearby ocean currents, and illustrative long-term mean temperatures. Have them rank the temperatures and explain how the geographic evidence could help account for the pattern.
Compare Reykjavik and an Icelandic highland on elevation and ocean-current maps, then locate a hot spring and discuss its local effect.
Free download
Printable 6.10.c Worksheet
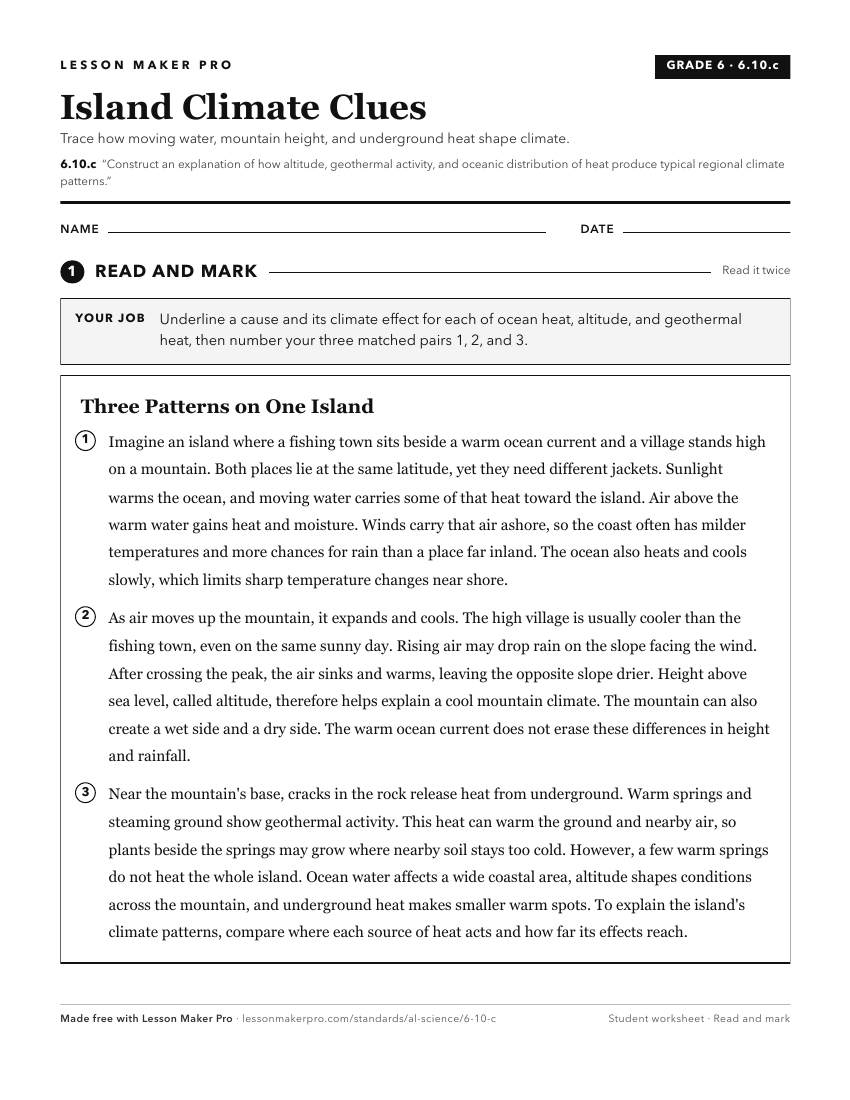
A ready-to-print activity worksheet aligned to 6.10.c, with an answer key for the teacher on its own page. No account needed.
PDF, US Letter, prints cleanly in black and white.
Download the worksheetKeep exploring
Related Standards
- 6.10.b
Construct explanations of how the tilt and curvature of the Earth cause unequal heating of its surface, resulting in regional climates based on patterns of lati...
- 6.10.a
Develop models demonstrating how unequal heating and the rotation of the Earth cause local and global wind systems and oceanic currents.
- ESS.7.b
Plan and carry out an investigation to determine the differential heating of land and water and explain how these differences create changes in local and global...
- 6.10
Use observations and data from investigations to demonstrate how the sun, air, land, and water affect Earth’s climate.
Turn this exact standard into a lesson
Grade, subject, topic, and the complete standard are prefilled. Create one free, no account needed.
Also for this standard:Make a WorksheetMake a QuizMake a Sub Lesson