Alabama Math MM.D3D.B
Standard Cluster
Functions can be used to represent general trends in conditions that change over time and to predict future conditions based on present observations.
2019 Alabama Course of Study: Mathematics · Mathematical Modeling
Cluster contents
Standards in This Cluster
MM.D3D.B is a cluster heading. These are the individual standards under it.
- MM.D3D.B.14
Use elements of the Mathematical Modeling Cycle to make predictions based on measurements that change over time, including motion, growth, decay, and cycling.
- MM.D3D.B.15
Use regression with statistical graphing technology to determine an equation that best fits a set of bivariate data, including nonlinear patterns.
- MM.D3D.B.15.a
Create a scatter plot with a sufficient number of data points to predict a pattern.
- MM.D3D.B.15.b
Describe the overall relationship between two quantitative variables (increase, decrease, linearity, concavity, extrema, inflection) or pattern of change.
- MM.D3D.B.15.c
Make a prediction based upon patterns.
- MM.D3D.B.16
Create a linear representation of non-linear data and interpret solutions, using technology and the process of linearization with logarithms.
Teacher's field guide
What This Cluster Means
What Students Need to Do
- Students plot data collected over time and choose a function that follows the overall pattern. They use it to predict a later value and explain why the prediction might miss.
What Mastery Looks Like
- Given a table of yearly counts, a student can tell whether a constant increase or constant percent growth fits better. They write a rule, predict a future value, and explain a limit of that prediction.
Common Misconceptions
- Students often use a straight line even when the increases grow each year. They may assume a trend will continue forever or mistake a seasonal dip for a lasting decline.
How to Assess It
- Exit ticket: A town counts 100, 110, 120, and 130 bike commuters from 2021 through 2024. Write a rule, predict the 2026 count, and give one reason it could differ.
Lesson moves
Ways to Teach It
Place chilled water in a cup; record its temperature every two minutes, graph it, choose a trend rule, and predict the next reading.
Show two five-year tables, one adding 10 each year and one growing 10 percent; ask which rule students would trust for year six and why.
Give pairs cards with five-year tables and linear or exponential graphs; have them match the cards and predict the next value.
Print six months of a sample household electricity bill; have students graph the kilowatt-hours, estimate month seven, and discuss how seasons might affect it.
Free download
Printable MM.D3D.B Worksheet
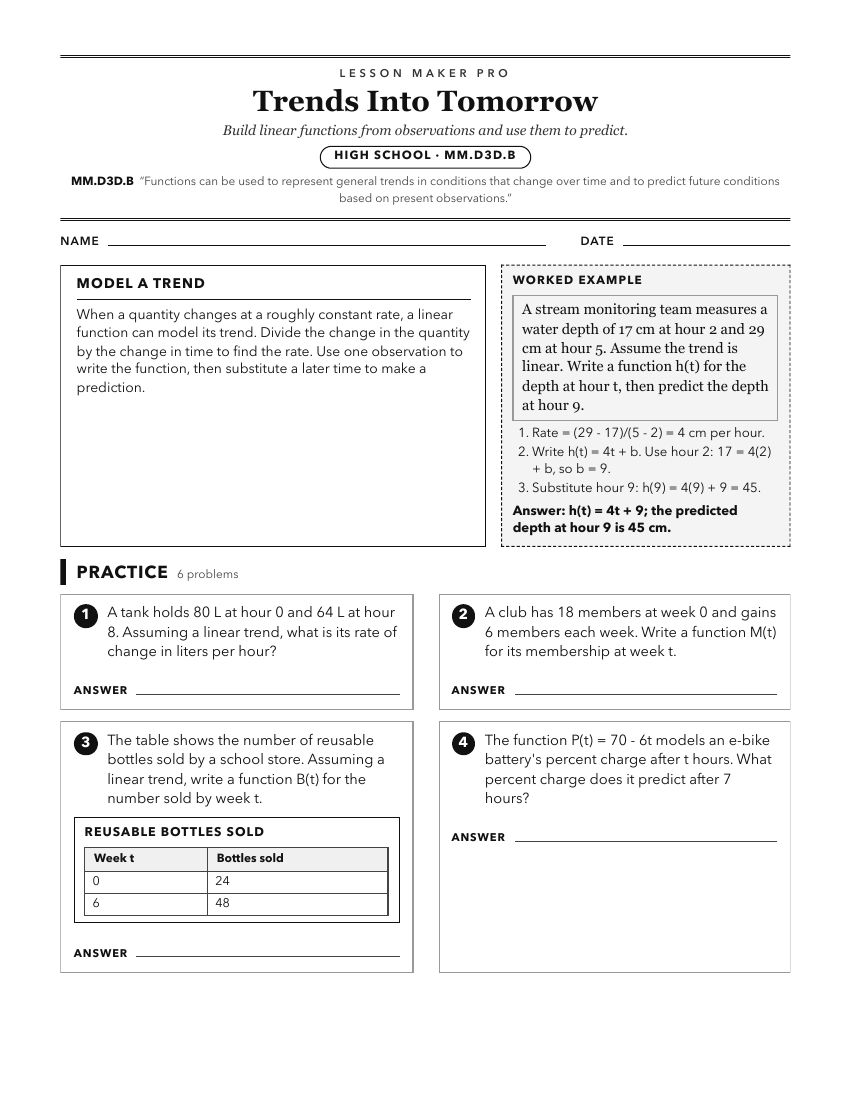
A ready-to-print activity worksheet aligned to MM.D3D.B, with an answer key for the teacher on its own page. No account needed.
PDF, US Letter, prints cleanly in black and white.
Download the worksheetKeep exploring
Related Standards
- A2S.AF.H
Functions can be represented graphically, and key features of the graphs, including zeros, intercepts, and, when relevant, rate of change and maximum/minimum va...
- 8A.AF.J
Functions can be represented graphically and key features of the graphs, including zeros, intercepts, and, when relevant, rate of change and maximum/minimum val...
- 7A.DSP.C.30.a
Collect and use data to predict probabilities of events.
Turn this cluster into a lesson
Grade, subject, topic, and the complete cluster are prefilled. Create one free, no account needed.
Also for this cluster:Make a WorksheetMake a QuizMake a Sub Lesson