Alabama Math 7.DSP.A.10
Standard Cluster
- 7.DSP.A
- Make inferences about a population using random sampling.
Examine a sample of a population to generalize information about the population. a. Differentiate between a sample and a population. b. Compare sampling techniques to determine whether a sample is random and thus representative of a population, explaining that random sampling tends to produce representative samples and support valid inferences. c. Determine whether conclusions and generalizations can be made about a population based on a sample. d. Use data from a random sample to draw inferences about a population with an unknown characteristic of interest, generating multiple samples to gauge variation and making predictions or conclusions about the population. e. Informally explain situations in which statistical bias may exist.
2019 Alabama Course of Study: Mathematics · Data Analysis, Statistics, and Probability
Cluster contents
Standards in This Cluster
7.DSP.A.10 is a cluster heading. These are the individual standards under it.
- 7.DSP.A.10.a
Differentiate between a sample and a population.
- 7.DSP.A.10.b
Compare sampling techniques to determine whether a sample is random and thus representative of a population, explaining that random sampling tends to produce re...
- 7.DSP.A.10.c
Determine whether conclusions and generalizations can be made about a population based on a sample.
- 7.DSP.A.10.d
Use data from a random sample to draw inferences about a population with an unknown characteristic of interest, generating multiple samples to gauge variation a...
- 7.DSP.A.10.e
Informally explain situations in which statistical bias may exist.
Teacher's field guide
What This Cluster Means
What Students Need to Do
- Students tell the difference between the whole group and the smaller group surveyed. They check how that smaller group was chosen, then use several random samples to estimate a result for the whole group. They look for selection methods that could skew the result.
What Mastery Looks Like
- A student can explain why drawing names from a full roster is fairer than asking friends. They use several random samples to make an estimate, describe how the results vary, and avoid treating one estimate as exact.
Common Misconceptions
- Students may call any small group random, even if everyone comes from one lunch table. They may treat a sample percentage as the exact population percentage or think a larger biased sample fixes the bias.
How to Assess It
- Exit ticket: In a school of 600, 12 of 30 students drawn randomly from the roster ride the bus; 20 of 30 asked at one lunch table do. Which sample supports a schoolwide estimate, about how many students ride, and why might another random draw give a different result?
Lesson moves
Ways to Teach It
Fill a bag with mixed-color beads; teams draw 10 without looking, record colors, replace them, and repeat to compare estimates.
Ask: Would surveying the first 20 students at basketball practice tell us how the whole school gets to school? Defend your answer.
Give pairs four survey cards with different selection methods; have them sort the cards into random and biased piles and defend one choice.
For a class lunch vote, draw names from the class roster, estimate pizza preference, and compare with asking only students near the door.
Free download
Printable 7.DSP.A.10 Worksheet
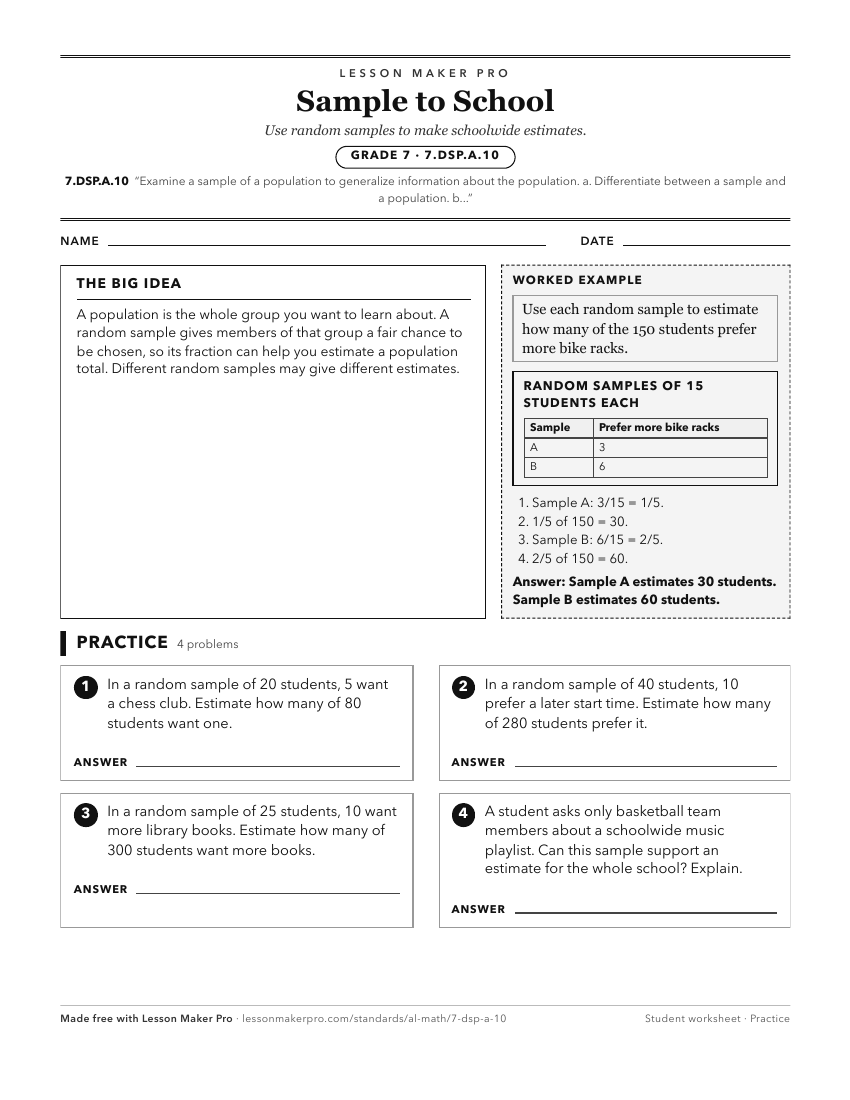
A ready-to-print activity worksheet aligned to 7.DSP.A.10, with an answer key for the teacher on its own page. No account needed.
PDF, US Letter, prints cleanly in black and white.
Download the worksheetKeep exploring
Related Standards
- 7A.DSP.A.26
Examine a sample of a population to generalize information about the population.
- 7A.DSP.A.26.c
Determine whether conclusions and generalizations can be made about a population based on a sample.
- 7A.DSP.A.26.d
Use data from a random sample to draw inferences about a population with an unknown characteristic of interest, generating multiple samples to gauge variation a...
Turn this cluster into a lesson
Grade, subject, topic, and the complete cluster are prefilled. Create one free, no account needed.
Also for this cluster:Make a WorksheetMake a QuizMake a Sub Lesson