Alabama Math 7A.DSP.A.26
Standard Cluster
- 7A.DSP.A
- Make inferences about a population using random sampling.
Examine a sample of a population to generalize information about the population. a. Differentiate between a sample and a population. b. Compare sampling techniques to determine whether a sample is random and thus representative of a population, explaining that random sampling tends to produce representative samples and support valid inferences. c. Determine whether conclusions and generalizations can be made about a population based on a sample. d. Use data from a random sample to draw inferences about a population with an unknown characteristic of interest, generating multiple samples to gauge variation and make predictions or conclusions about the population. e. Informally explain situations in which statistical bias may exist.
2019 Alabama Course of Study: Mathematics
Cluster contents
Standards in This Cluster
7A.DSP.A.26 is a cluster heading. These are the individual standards under it.
- 7A.DSP.A.26.a
Differentiate between a sample and a population.
- 7A.DSP.A.26.b
Compare sampling techniques to determine whether a sample is random and thus representative of a population, explaining that random sampling tends to produce re...
- 7A.DSP.A.26.c
Determine whether conclusions and generalizations can be made about a population based on a sample.
- 7A.DSP.A.26.d
Use data from a random sample to draw inferences about a population with an unknown characteristic of interest, generating multiple samples to gauge variation a...
- 7A.DSP.A.26.e
Informally explain situations in which statistical bias may exist.
Teacher's field guide
What This Cluster Means
What Students Need to Do
- Students identify the whole group and the smaller group studied. They decide whether a sample was selected by chance from the whole group. They use several random samples to estimate an unknown value and explain how biased selection can distort a claim.
What Mastery Looks Like
- A student can explain why surveying one class may not describe the whole school and choose a random selection method instead. They can compare estimates from several samples, describe how the estimates vary, and make a cautious prediction about the whole school.
Common Misconceptions
- Students may call a group of friends a random sample because no one chose their answers. They may treat one sample estimate as the exact population value or assume every random sample perfectly matches the population.
How to Assess It
- Exit ticket: A school of 400 students wants to estimate how many walk to school. Identify the population, choose between 20 random student IDs and 20 bus riders, then use three random samples of 20 with 6, 8, and 7 walkers to predict the total and explain why the counts differ.
Lesson moves
Ways to Teach It
Hide 40 mixed-color counters in an opaque cup; draw, replace, and shake 10 times per sample, then compare five estimates of total reds.
Ask: Can the first 20 students entering the cafeteria describe the whole school? Name who is missed and why.
Give pairs cards showing randomly drawn IDs, lunch-line volunteers, one homeroom, and online volunteers; have them sort the methods by likely bias.
For a school lunch survey, draw 30 names from the full roster and discuss why asking only lunch buyers could skew the results.
Free download
Printable 7A.DSP.A.26 Worksheet
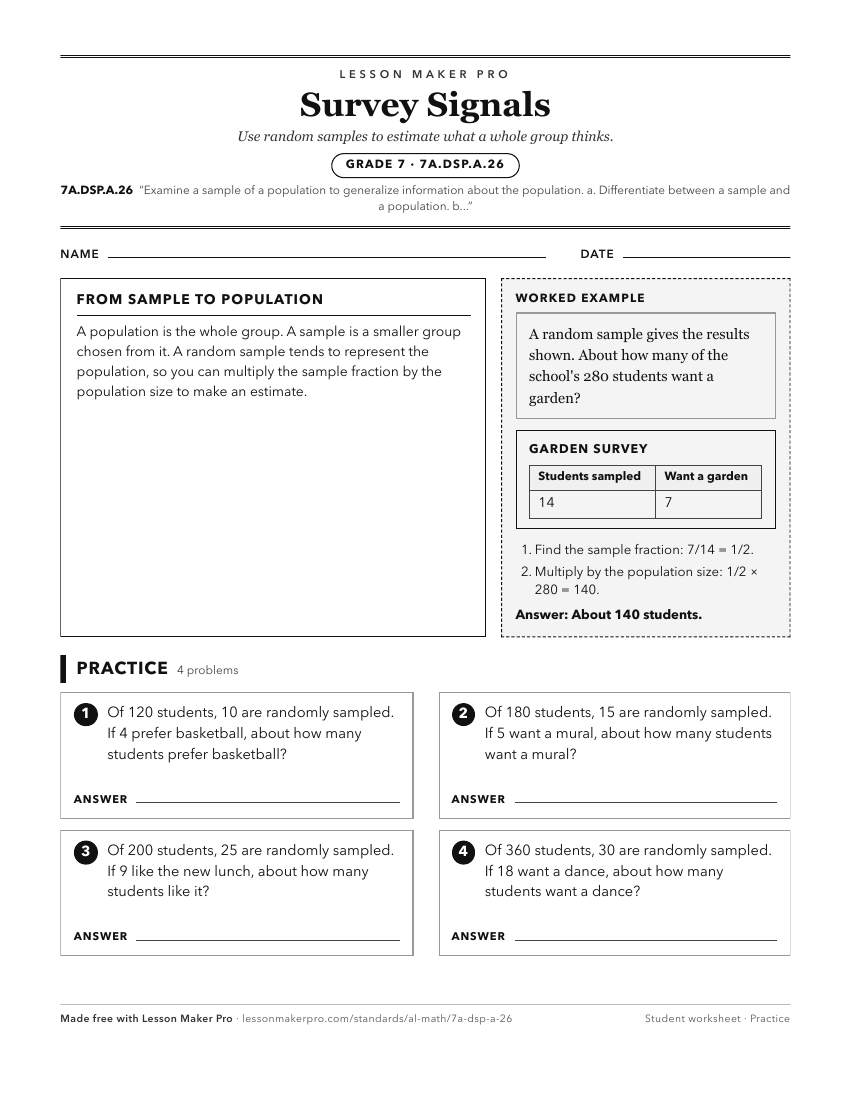
A ready-to-print activity worksheet aligned to 7A.DSP.A.26, with an answer key for the teacher on its own page. No account needed.
PDF, US Letter, prints cleanly in black and white.
Download the worksheetKeep exploring
Related Standards
Turn this cluster into a lesson
Grade, subject, topic, and the complete cluster are prefilled. Create one free, no account needed.
Also for this cluster:Make a WorksheetMake a QuizMake a Sub Lesson