Virginia SOL 6.1.d.i
The Standard
- 6.1
- The student will demonstrate an understanding of scientific and engineering practices by
constructing and critiquing conclusions and explanations construct explanations that includes qualitative or quantitative relationships between variables
Virginia Standards of Learning for Science · The student will demonstrate an understanding of scientific and engineering practices by
Teacher's field guide
What This Standard Means
What Students Need to Do
- Students identify how one variable changes in relation to another. They use observations or measurements as evidence, then check whether an explanation fits the data.
What Mastery Looks Like
- Given a table, graph, or investigation results, students describe the relationship using clear words or numbers. They support the explanation with specific evidence and reject claims that conflict with the data.
Common Misconceptions
- Students may describe the data without explaining the relationship between variables. They may claim that one variable caused another, ignore conflicting results, or use opinions instead of measured evidence.
How to Assess It
- Show plant growth of 2, 5, and 8 centimeters after receiving 0, 5, and 10 milliliters of water. Ask students to explain the relationship and cite two values.
Lesson moves
Ways to Teach It
Test paper helicopters with two wing lengths, time three drops each, and write an explanation linking wing length to fall time.
Discuss which claim best fits a class graph, then cite one measured value that supports the choice.
Play a card match using data tables, relationship statements, and evidence cards, rejecting any match the numbers do not support.
Compare local temperatures and electricity use across five days, then explain the relationship and name another factor that could affect use.
Free download
Printable 6.1.d.i Worksheet
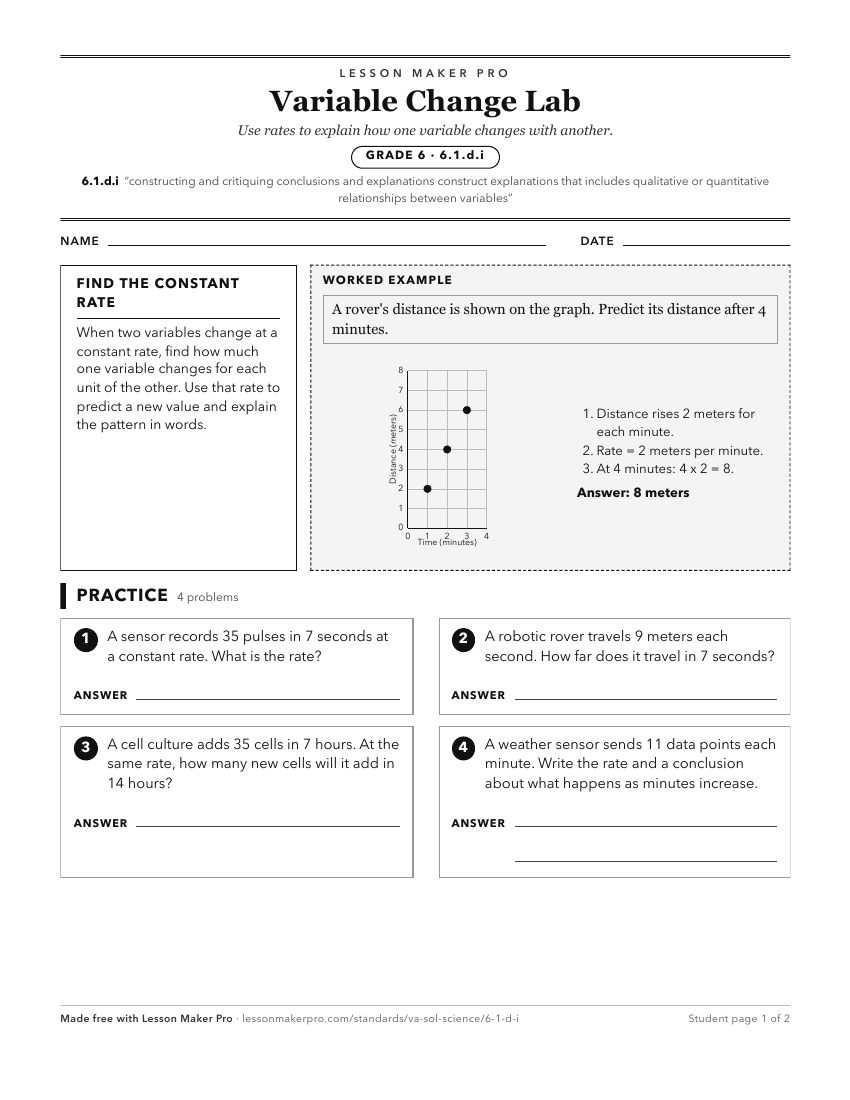
A ready-to-print activity worksheet aligned to 6.1.d.i, with an answer key for the teacher on its own page. No account needed.
PDF, US Letter, prints cleanly in black and white.
Download the worksheetKeep exploring
Related Standards
- PS.1.a.ii
develop hypotheses indicating relationships between independent and dependent variables
- 5.1.a.ii
develop hypotheses as cause-and-effect relationship
- 4.1.a.ii
develop hypotheses as cause-and-effect relations
- LS.1.d.i
construct explanations that include qualitative or quantitative relationships between variables
Turn this exact standard into a lesson
Grade, subject, topic, and the complete standard are prefilled. Create one free, no account needed.
Also for this standard:Make a WorksheetMake a QuizMake a Sub Lesson