Virginia SOL 2.6.b
The Standard
- 2.6
- The student will investigate and understand that there are different types of weather on Earth. Key ideas include
measuring, recording, and interpreting weather data allows for identification of weather patterns
Virginia Standards of Learning for Science
Teacher's field guide
What This Standard Means
What Students Need to Do
- Students use simple tools to collect temperature, rainfall, wind, and cloud data. They record results in a table or graph, then use repeated observations to describe weather patterns.
What Mastery Looks Like
- Students choose the correct tool, record measurements with units, and read a weather chart accurately. They identify a pattern and support it with two or more data points.
Common Misconceptions
- Students may call a single weather event a pattern or assume weather repeats exactly each day. They may confuse wind direction with speed, omit units, or describe a graph without citing data.
How to Assess It
- Give students temperatures of 50, 53, 56, 59, and 62 degrees for five days. Ask, “What pattern do you notice, and which data support your answer?”
Lesson moves
Ways to Teach It
Set up a thermometer, rain gauge, windsock, and cloud chart outside, then have teams measure and record each condition.
Ask students to write, “What weather pattern did our class observe this week, and what evidence proves it?”
Give pairs weather cards to arrange by date, then award a point for each pattern correctly supported with two cards.
Compare the class weather chart with a local forecast, then discuss how recorded patterns help people choose clothing and plan outdoor work.
Free download
Printable 2.6.b Worksheet
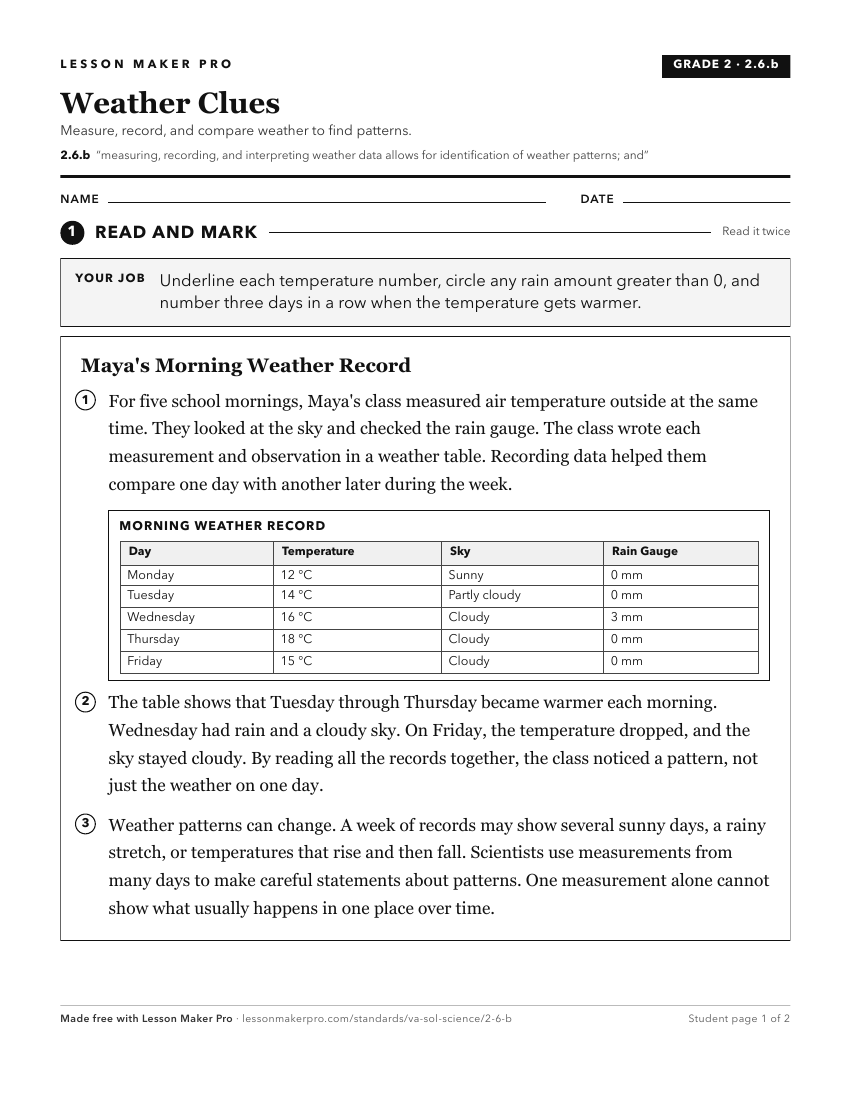
A ready-to-print activity worksheet aligned to 2.6.b, with an answer key for the teacher on its own page. No account needed.
PDF, US Letter, prints cleanly in black and white.
Download the worksheetKeep exploring
Related Standards
Turn this exact standard into a lesson
Grade, subject, topic, and the complete standard are prefilled. Create one free, no account needed.
Also for this standard:Make a WorksheetMake a QuizMake a Sub Lesson