Texas TEKS 7.10.C
The Standard
- 7.10
- Geography. The student understands the characteristics, distribution, and migration of population in Texas in the 19th, 20th, and 21st centuries. The student is expected to:
describe the structure of the population of Texas using demographic concepts such as growth rate and age distribution
Texas Essential Knowledge and Skills for Social Studies
Teacher's field guide
What This Standard Means
What Students Need to Do
- Students interpret Texas census tables, growth rates, and age-group charts. They compare places or years and explain what the data shows about the population.
What Mastery Looks Like
- A student can identify the largest age group and determine which place or period grew faster. The student supports each conclusion with numbers from the data.
Common Misconceptions
- Students may confuse total population with growth rate. They may assume the largest age group is also the fastest-growing group. Some compare raw totals when the chart shows percentages.
How to Assess It
- Exit ticket: A Texas county is 24% ages 0 to 17, 62% ages 18 to 64, and 14% age 65 or older. Write two accurate statements about its population structure.
Lesson moves
Ways to Teach It
Give groups 100 counters to model three age groups from a Texas county data table, then compare models.
Ask students to write which public service a fast-growing county should expand first, using age data as evidence.
Play a chart-match game where students pair Texas population graphs with accurate descriptions and reject misleading claims.
Give students a county profile and ask them to recommend a school, clinic, or senior center based on the data.
Free download
Printable 7.10.C Worksheet
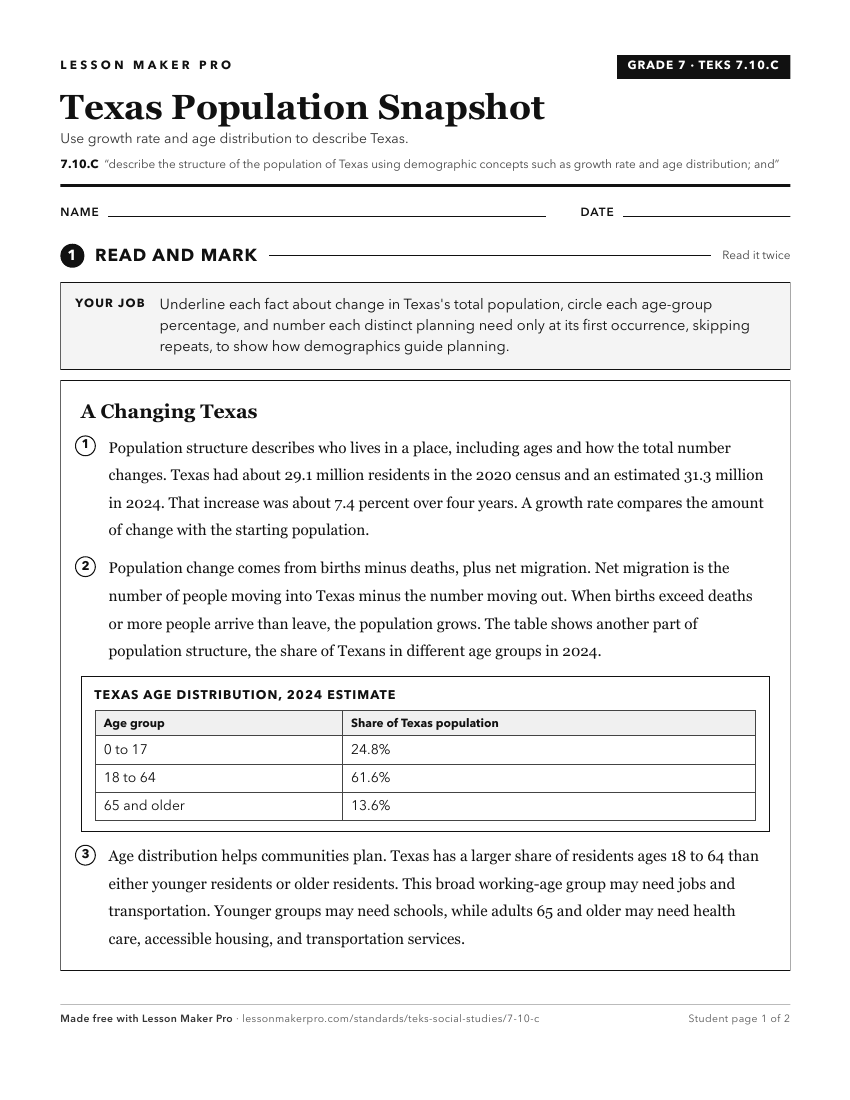
A ready-to-print activity worksheet aligned to 7.10.C, with an answer key for the teacher on its own page. No account needed.
PDF, US Letter, prints cleanly in black and white.
Download the worksheetKeep exploring
Related Standards
- 7.10.D
analyze the effects of the changing population distribution and growth in Texas and the additional need for education, health care, and transportation.
- 4.7.A
explain the geographic factors such as landforms and climate that influence patterns of settlement and the distribution of population in Texas, past and present
- 4.11.C
identify the effects of exploration, immigration, migration, and limited resources on the economic development and growth of Texas
- 7.21.B
analyze and interpret geographic distributions and patterns in Texas during the 19th, 20th, and 21st centuries.
Turn this exact standard into a lesson
Grade, subject, topic, and the complete standard are prefilled. Create one free, no account needed.
Also for this standard:Make a WorksheetMake a QuizMake a Sub Lesson