TEKS Math 2.10.C
The Standard
write and solve one-step word problems involving addition or subtraction using data represented within pictographs and bar graphs with intervals of one
Texas Essential Knowledge and Skills for Mathematics
Teacher's field guide
What This Standard Means
What Students Need to Do
- Students read pictographs and bar graphs where each picture or step represents one item. They use graph counts to write and solve an addition or subtraction story problem.
What Mastery Looks Like
- Students get accurate counts from each graph and choose addition or subtraction to match the question. They can write their own clear question, show a matching equation, and label the answer.
Common Misconceptions
- Students may count grid lines instead of bar units or treat one picture as more than one item. They may add when a question asks for the difference, or subtract when it asks for a total. Some write a number sentence that does not match the graph.
How to Assess It
- Show a bar graph with 7 cats, 5 dogs, and 3 fish. Ask: “Write and solve one addition or subtraction question using two categories.”
Lesson moves
Ways to Teach It
Use linking cubes to build bars for favorite fruits, then have pairs write and solve one addition or subtraction problem.
Display a class graph and ask, “What words in your question tell a reader to add or subtract?”
Play Graph Question Swap: students draw graph cards, write a problem, trade cards, solve, and check each other’s equations.
Tally playground equipment during recess, make a bar graph, then write a question comparing two equipment counts.
Free download
Printable 2.10.C Worksheet
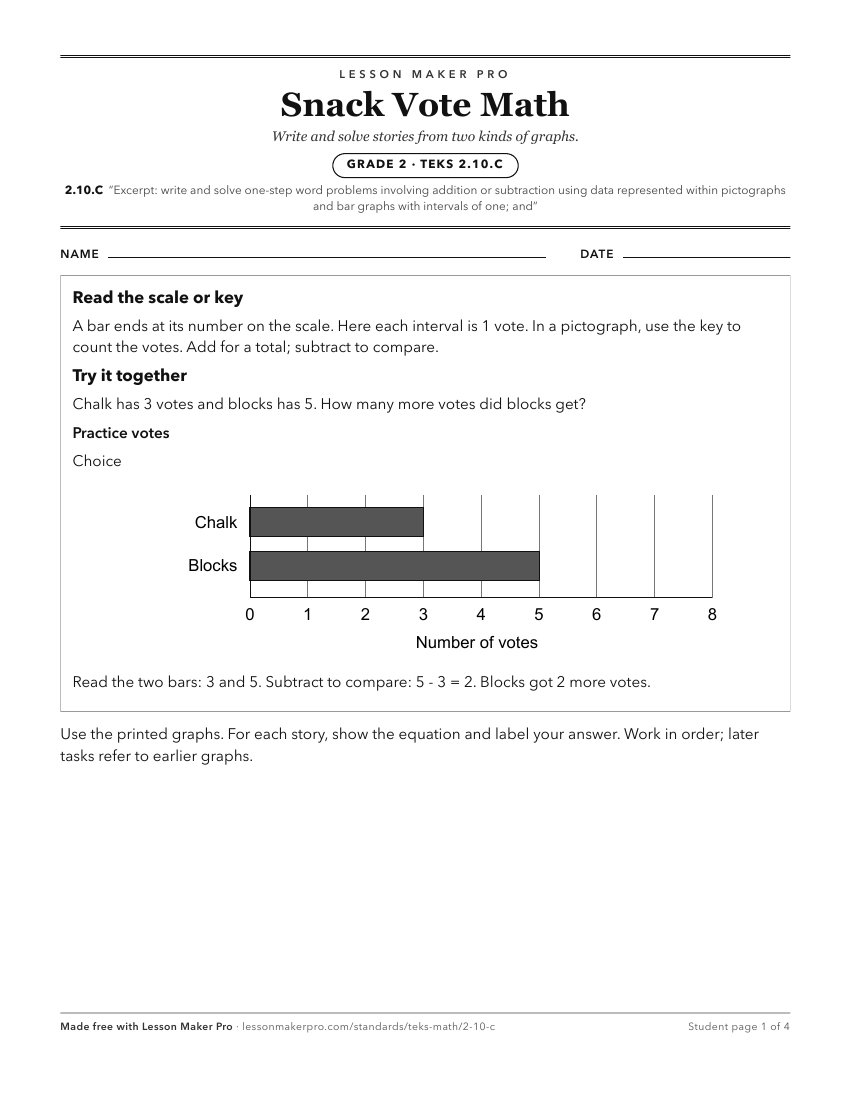
A ready-to-print activity worksheet aligned to 2.10.C, with an answer key for the teacher on its own page. No account needed.
PDF, US Letter, prints cleanly in black and white.
Download the worksheetKeep exploring
Related Standards
- 1.5.D
represent word problems involving addition and subtraction of whole numbers up to 20 using concrete and pictorial models and number sentences
- 7.6.G
solve problems using data represented in bar graphs, dot plots, and circle graphs, including part-to-whole and part-to-part comparisons and equivalents;
- 3.5.A
represent one- and two-step problems involving addition and subtraction of whole numbers to 1,000 using pictorial models, number lines, and equations
- 2.4.C
solve one-step and multi-step word problems involving addition and subtraction within 1,000 using a variety of strategies based on place value, including algori...
Turn this exact standard into a lesson
Grade, subject, topic, and the complete standard are prefilled. Create one free, no account needed.
Also for this standard:Make a WorksheetMake a QuizMake a Sub Lesson