TEKS Math 2.10.A
The Standard
explain that the length of a bar in a bar graph or the number of pictures in a pictograph represents the number of data points for a given category
Texas Essential Knowledge and Skills for Mathematics
Teacher's field guide
What This Standard Means
What Students Need to Do
- Students match each graph category to its count. They explain how the marks for a category show how many responses were recorded.
What Mastery Looks Like
- Given a graph, students name the count for any category and point to the marks that prove it. They explain why one category has more, fewer, or the same number.
Common Misconceptions
- Some students count grid lines instead of spaces or focus on a bar’s width. Others treat pictograph symbols as decoration instead of counted responses.
How to Assess It
- Show a graph with 6 votes for cats. Ask, “How does the graph show that 6 students chose cats?”
Lesson moves
Ways to Teach It
Give pairs linking cubes to build bars for class pet votes, then match each bar to the number of votes.
Display two graph categories and ask, “How do the bars or pictures prove which category has more responses?”
Play Graph Detective by showing a category card and having students race to find and explain its count on a graph.
Survey favorite recess activities, graph the results with sticky notes, and connect each note to one student’s choice.
Free download
Printable 2.10.A Worksheet
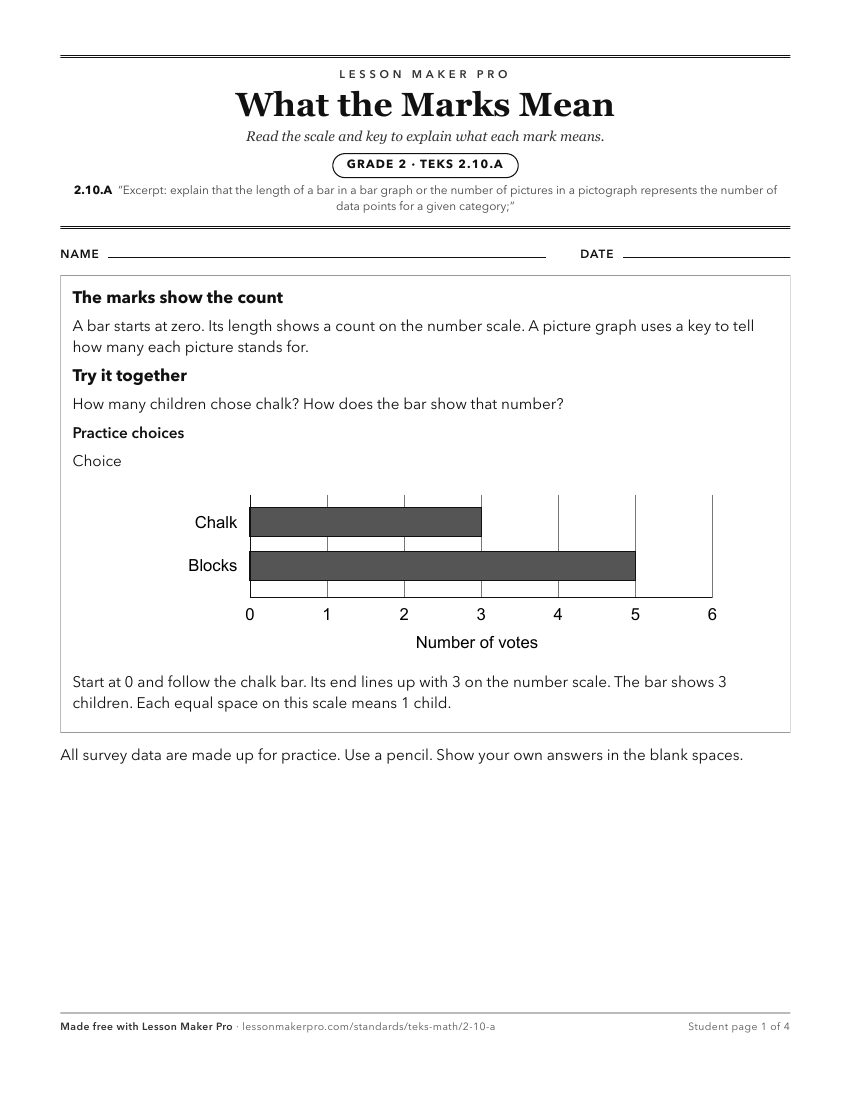
A ready-to-print activity worksheet aligned to 2.10.A, with an answer key for the teacher on its own page. No account needed.
PDF, US Letter, prints cleanly in black and white.
Download the worksheetKeep exploring
Related Standards
- 1.8.C
draw conclusions and generate and answer questions using information from picture and bar-type graphs
- 5.9.A
represent categorical data with bar graphs or frequency tables and numerical data, including data sets of measurements in fractions or decimals, with dot plots ...
- 2.10.B
organize a collection of data with up to four categories using pictographs and bar graphs with intervals of one or more
- 1.8.B
use data to create picture and bar-type graphs
Turn this exact standard into a lesson
Grade, subject, topic, and the complete standard are prefilled. Create one free, no account needed.
Also for this standard:Make a WorksheetMake a QuizMake a Sub Lesson