TEKS Math 2.10.B
The Standard
organize a collection of data with up to four categories using pictographs and bar graphs with intervals of one or more
Texas Essential Knowledge and Skills for Mathematics
Teacher's field guide
What This Standard Means
What Students Need to Do
- Students sort data into no more than four groups. They show each group’s total in pictographs and bar graphs using a clear key or numbered scale. Their labels, symbols, and bar heights must match the data.
What Mastery Looks Like
- Students create an accurate pictograph and bar graph from the same set of data. They include category labels, a clear key or scale, equal intervals, and symbols or bars that match each total.
Common Misconceptions
- Students may treat every picture as one item even when the key says each picture represents two or more. They may skip scale numbers, make uneven intervals, or draw bar heights that do not match the totals. Some forget category labels or count grid lines instead of intervals.
How to Assess It
- Give students category totals of 2, 4, 6, and 8. Ask them to make a pictograph with a key of two and a matching bar graph with intervals of two.
Lesson moves
Ways to Teach It
Sort 20 colored cubes into four cups, record each total, then build a floor bar graph with tape and number cards.
Ask, "How does changing the scale from 1 to 2 change the graph without changing the data?"
Play Graph Match by pairing data cards with pictographs or bar graphs, then explain how the key or scale proves each match.
Graph teacher-provided library checkout totals for four genres, using a scale of five books per interval.
Free download
Printable 2.10.B Worksheet
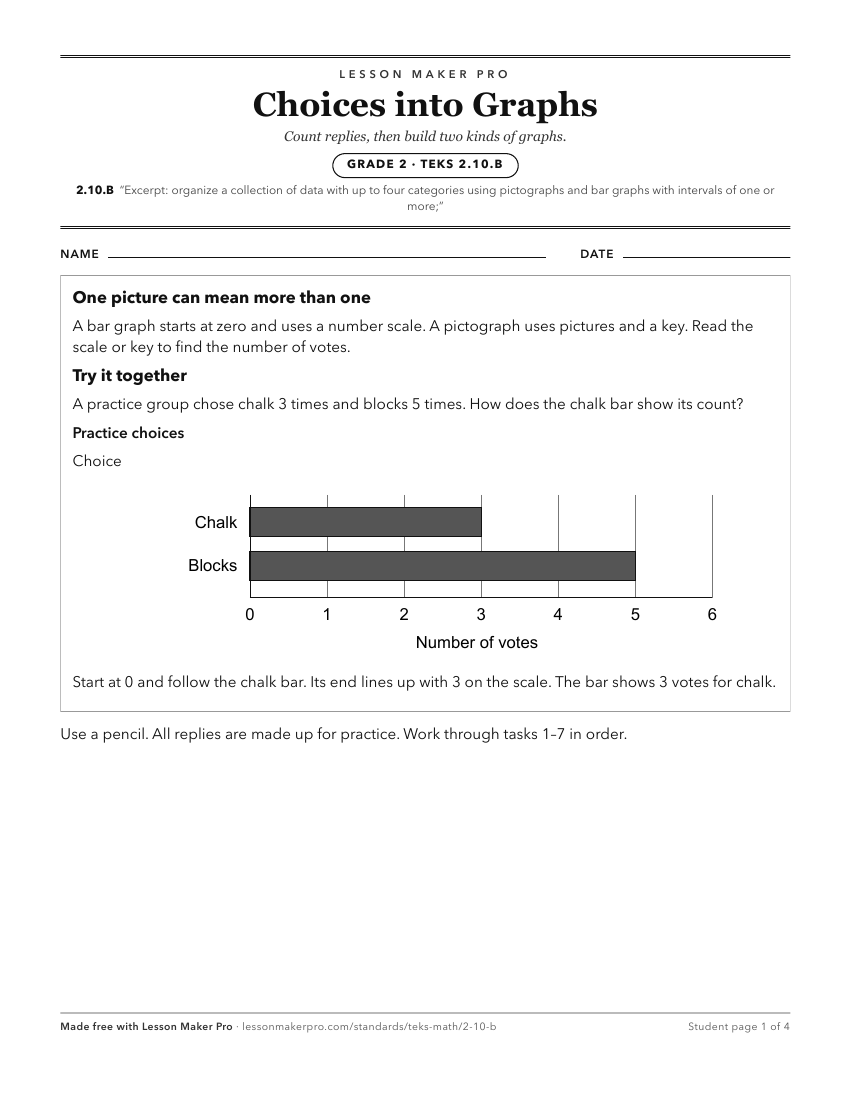
A ready-to-print activity worksheet aligned to 2.10.B, with an answer key for the teacher on its own page. No account needed.
PDF, US Letter, prints cleanly in black and white.
Download the worksheetKeep exploring
Related Standards
- 5.9.A
represent categorical data with bar graphs or frequency tables and numerical data, including data sets of measurements in fractions or decimals, with dot plots ...
- 1.8.A
collect, sort, and organize data in up to three categories using models/representations such as tally marks or T-charts
- K.8.A
collect, sort, and organize data into two or three categories
- 3.8.A
summarize a data set with multiple categories using a frequency table, dot plot, pictograph, or bar graph with scaled intervals
Turn this exact standard into a lesson
Grade, subject, topic, and the complete standard are prefilled. Create one free, no account needed.
Also for this standard:Make a WorksheetMake a QuizMake a Sub Lesson