Oklahoma Social Studies 3.C.2.1
The Standard
- 3.C.2
- Examine Oklahoma’s geography and how people of Oklahoma interact with their environment.
Use maps, graphs, photographs, charts, and geographic technology to organize information about people, places, and environments of the state.
Oklahoma Academic Standards for Social Studies (2026) · 3.C.2
Teacher's field guide
What This Standard Means
What Students Need to Do
- Students use Oklahoma maps, photos, graphs, charts, and digital maps to find facts about people, places, and the land. They put those facts in a simple chart and show where places are.
What Mastery Looks Like
- A student can find a river on a map, read which town has more people from a graph, and describe land shown in a photo. They sort each fact under people, places, or environment and name its source.
Common Misconceptions
- Students may think one photo shows what an entire county looks like. They may mistake a blue line on a map for a road or think the tallest population bar means the largest town by area.
How to Assess It
- Give students a labeled Oklahoma map, a captioned photo of the Arkansas River, and a two-bar town population graph. Ask them to circle the river, name the town with more people, and sort those facts under people or environment.
Lesson moves
Ways to Teach It
Give pairs a paper Oklahoma map and a captioned river photo; have them mark the river and label one nearby town.
Show a farm photo and a county rainfall graph; ask students to write one fact each source shows about the area.
Hand out fact cards with Oklahoma maps, photos, charts, and graphs; teams sort the facts under people, places, or environment.
Open a digital county map; students find their school, a town, and a river or lake, then mark them on paper.
Free download
Printable 3.C.2.1 Worksheet
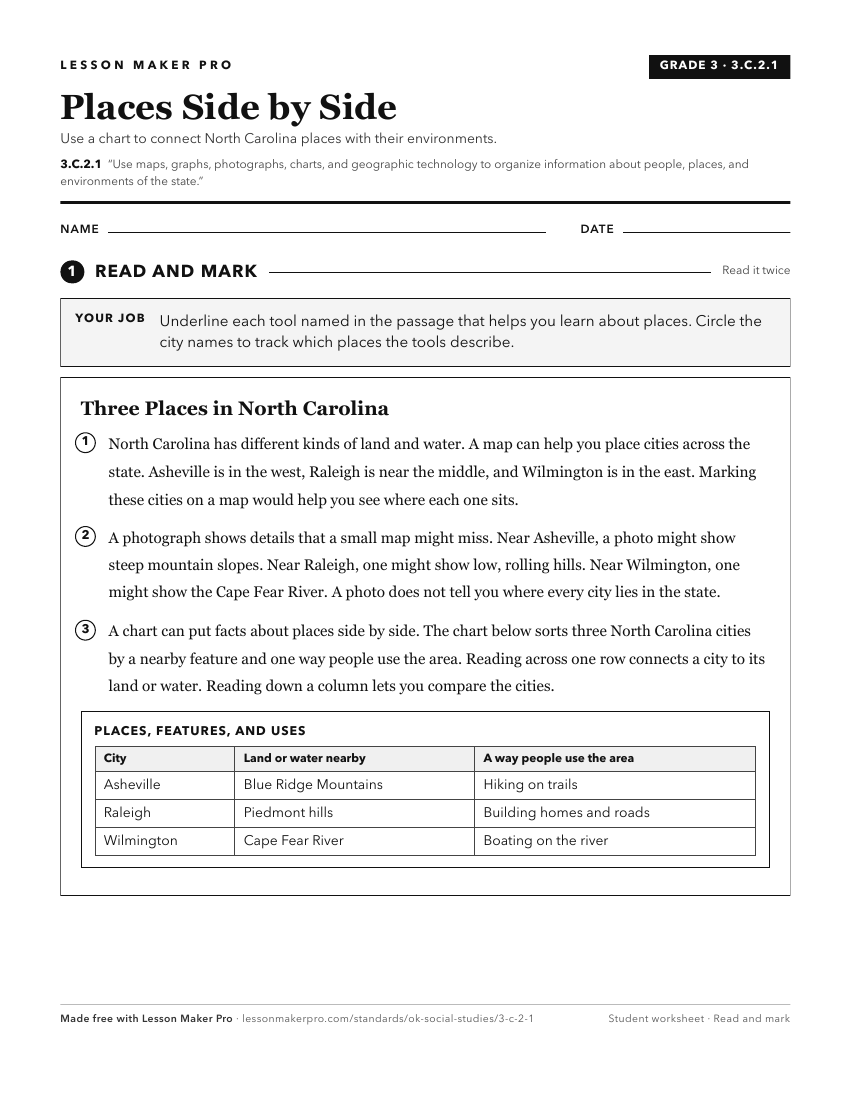
A ready-to-print activity worksheet aligned to 3.C.2.1, with an answer key for the teacher on its own page. No account needed.
PDF, US Letter, prints cleanly in black and white.
Download the worksheetKeep exploring
Related Standards
- 4.C.2.1.B
Use maps and other geographic representations (e.g., globes, charts, graphs) and geographic technologies to draw conclusions (e.g., settlement patterns, populat...
- 3.P.2.3.B
Describe the community and state’s human and physical environment by creating and using maps, graphs, and other geographic models, including aerial photography.
- 2.P.2.3.B
Describe the community and state’s human and physical environment by creating and using maps, graphs, and other geographic models, including aerial photography.
- 6.C.1.2.C
Use different types of maps, graphs, charts, and geographic tools, such as satellite imagery and Geographic Information System (GIS) technology to draw conclusi...
Turn this exact standard into a lesson
Grade, subject, topic, and the complete standard are prefilled. Create one free, no account needed.
Also for this standard:Make a WorksheetMake a QuizMake a Sub Lesson