Oklahoma Math S.IR.1
Standard Cluster
Interpret and communicate the results of a statistical analysis in context. Recognize when the difference between two sample proportions or two sample means is due to random variation or if the difference is statistically significant. Understand the concept of a confidence interval, including the interpretation of confidence level, margin of error, and statistical significance. Develop inferences or predictions to construct resulting decisions or recommendations. Create and evaluate recommendations for areas of future research.
Oklahoma Academic Standards for Mathematics (2022)
Cluster contents
Standards in This Cluster
S.IR.1 is a cluster heading. These are the individual standards under it.
- S.IR.1.1
Recognize when the difference between two sample proportions or two sample means is due to random variation or if the difference is statistically significant.
- S.IR.1.2
Understand the concept of a confidence interval, including the interpretation of confidence level, margin of error, and statistical significance.
- S.IR.1.3
Develop inferences or predictions to construct resulting decisions or recommendations.
- S.IR.1.4
Create and evaluate recommendations for areas of future research.
Teacher's field guide
What This Cluster Means
What Students Need to Do
- Students compare percentages or averages from two samples. They use a confidence interval to judge whether a gap could be due to random variation. They explain the result, recommend an action, and suggest a follow-up study.
What Mastery Looks Like
- A student checks whether a 95% interval for the difference includes zero before calling the gap statistically significant. They can identify the margin of error and explain that a 95% confidence method captures the true value in 95% of repeated samples. Their recommendation fits the data and names what to study next.
Common Misconceptions
- Students may call any gap significant, even when the interval includes zero. They may say 95% confidence means a 95% chance that this particular interval contains the fixed true value. They may mistake the margin of error for a calculation error or claim that a difference proves causation.
How to Assess It
- Exit ticket: A survey finds a 3-point gap in lunch approval, with a 95% interval from -2 to 8 points for the difference. Ask whether the gap is statistically significant, what the margin of error is, and what the school should study next.
Lesson moves
Ways to Teach It
Fill two bags with identical red and blue counter mixes; pairs draw 20 from each and graph the red-percentage gaps.
Show a 95% interval of 2 to 10 points for two menus' approval gap; ask, 'Would you change the menu? Why?'
Play Significance Sort with interval cards labeled [-3, 5], [1, 7], and [-8, -2]; teams sort by whether zero is included.
Post two bus routes' mean delays, 7 and 9 minutes, with a 95% difference interval of -1 to 5; request advice and follow-up data.
Free download
Printable S.IR.1 Worksheet
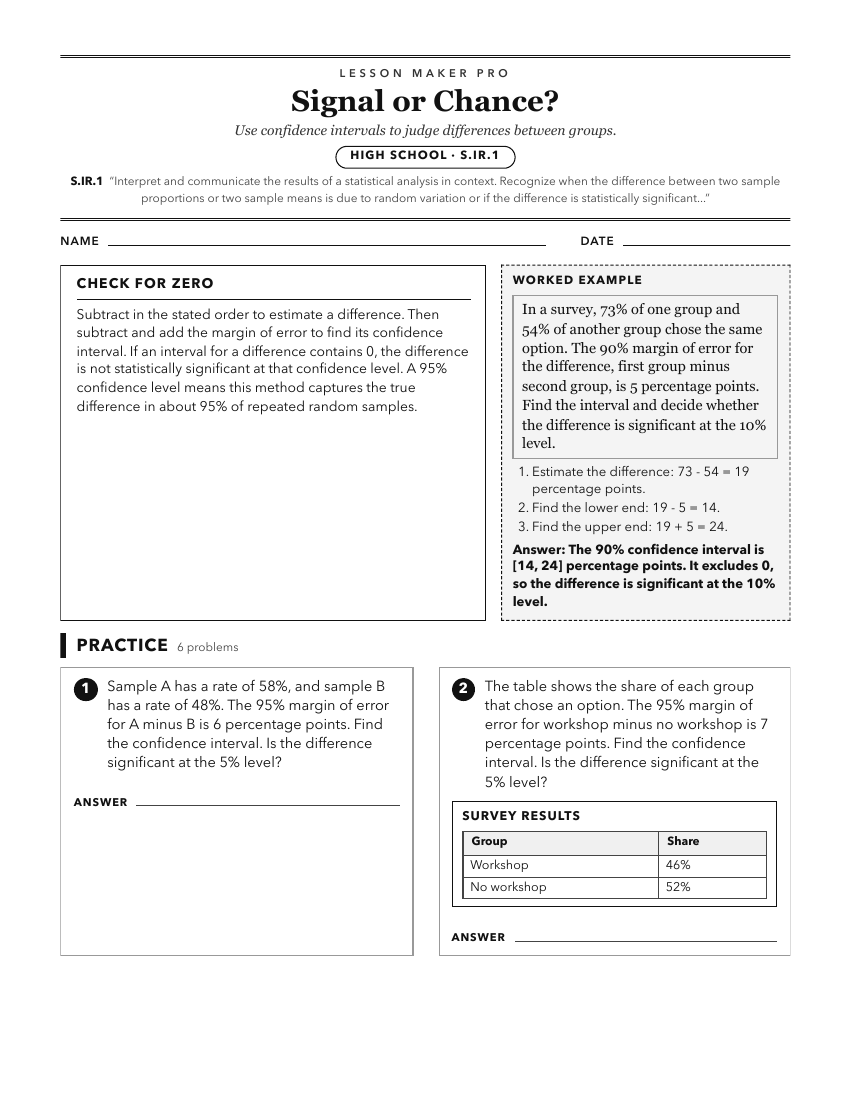
A ready-to-print activity worksheet aligned to S.IR.1, with an answer key for the teacher on its own page. No account needed.
PDF, US Letter, prints cleanly in black and white.
Download the worksheetKeep exploring
Related Standards
Turn this cluster into a lesson
Grade, subject, topic, and the complete cluster are prefilled. Create one free, no account needed.
Also for this cluster:Make a WorksheetMake a QuizMake a Sub Lesson