Oklahoma Math S.DA.1
Standard Cluster
Use distributions of quantitative and categorical data to identify the key features of the data collected in context. Summarize and represent the distribution for univariate quantitative data by describing and analyzing the shape of the distribution, the measures of center for the distribution, the patterns in variability for the distribution, and any outliers, gaps, or other unusual features in the distribution. Select and create an appropriate display (e.g., dot plots, histograms, box plots) for univariate data. Use statistics appropriate to the shape of the data distribution to compare center and variability of two or more different data sets. Describe and analyze the distribution of univariate categorical data.
Oklahoma Academic Standards for Mathematics (2022)
Cluster contents
Standards in This Cluster
S.DA.1 is a cluster heading. These are the individual standards under it.
- S.DA.1.1
Summarize and represent the distribution for univariate quantitative data by describing and analyzing the shape of the distribution, the measures of center for ...
- S.DA.1.2
Select and create an appropriate display (e.g., dot plots, histograms, box plots) for univariate data.
- S.DA.1.4
Describe and analyze the distribution of univariate categorical data.
Teacher's field guide
What This Cluster Means
What Students Need to Do
- Students choose a dot plot, histogram, or box plot for numerical data. They describe its shape, center, spread, gaps, and outliers, then compare groups using suitable statistics. For categories, they chart counts or percentages and name the most and least common.
What Mastery Looks Like
- Given two score lists, students choose plots, name each shape, and point out gaps or outliers. They compare centers and spreads using the mean and standard deviation for roughly symmetric scores, or the median and IQR for skewed scores. Given lunch-choice counts, they make a bar chart and compare percentages.
Common Misconceptions
- Students may choose the mean for skewed scores even when an outlier pulls it away from most values. They may compare category counts across groups of different sizes without using percentages. They may think the tallest histogram bar gives the median.
How to Assess It
- Exit ticket: Plot travel times of 6, 7, 8, 8, 9, 10, and 30 minutes. Mark the gap and outlier, then choose the mean or median for a typical time and explain why.
Lesson moves
Ways to Teach It
Make a sticky-note dot plot of commute times 8, 9, 10, 10, 11, 12, 13, 14, 15, 35; label the outlier.
Ask: A class has mostly high quiz scores and one very low score; would its mean or median better describe a typical score?
Deal each pair two sets of eight numbered playing cards; have them draw box plots and compare medians and IQRs.
Tally anonymous travel-to-school choices on the board; draw a bar chart and compare category percentages.
Free download
Printable S.DA.1 Worksheet
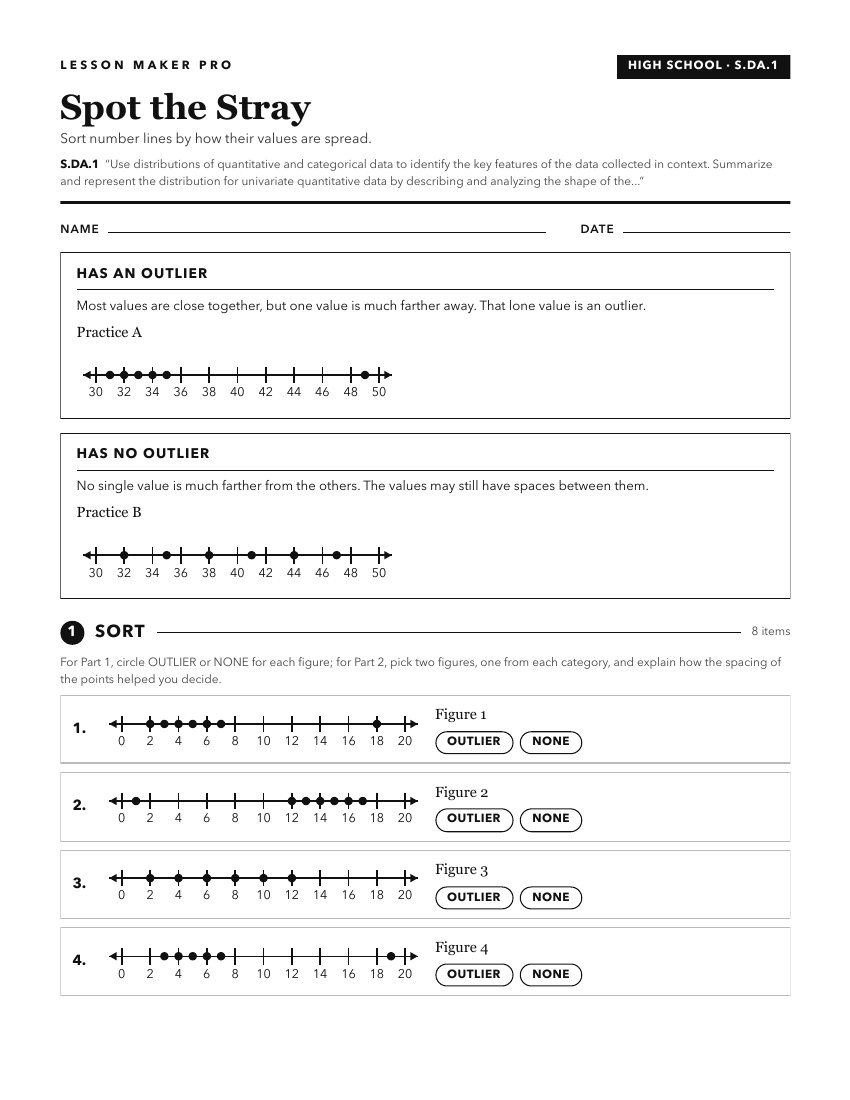
A ready-to-print activity worksheet aligned to S.DA.1, with an answer key for the teacher on its own page. No account needed.
PDF, US Letter, prints cleanly in black and white.
Download the worksheetKeep exploring
Related Standards
Turn this cluster into a lesson
Grade, subject, topic, and the complete cluster are prefilled. Create one free, no account needed.
Also for this cluster:Make a WorksheetMake a QuizMake a Sub Lesson