Oklahoma Math S.DA.1.4
The Standard
- S.DA.1
- Use distributions of quantitative and categorical data to identify the key features of the data collected in context.
Describe and analyze the distribution of univariate categorical data.
Oklahoma Academic Standards for Mathematics (2022)
Teacher's field guide
What This Standard Means
What Students Need to Do
- Students tally answers to one categorical question and show the results in a bar chart. They describe which categories are most and least common and explain what the counts or percentages mean in context.
What Mastery Looks Like
- A student can label a bar chart correctly and state that 12 of 20 students, or 60%, ride the bus. They can compare categories using counts or percentages.
Common Misconceptions
- Students may try to find an average for categories such as bus, car, and walking. They may confuse a count with a percent or draw a bar whose height does not match the count.
How to Assess It
- Exit ticket: In a class of 20, 12 ride the bus, 6 come by car, and 2 walk. Ask students to name the most common category, give its percentage, and compare it with another category.
Lesson moves
Ways to Teach It
Have students place sticky notes under bus, car, walking, or bike, then count the notes and draw a bar chart.
Show a class lunch-choice bar chart and ask students to write two sentences comparing the most and least popular choices.
Give pairs six frequency tables and six bar charts to match, then ask them to explain one match using counts.
Give students a tally of 20 cafeteria lunch choices and ask which option to make more of, using counts and percentages.
Free download
Printable S.DA.1.4 Worksheet
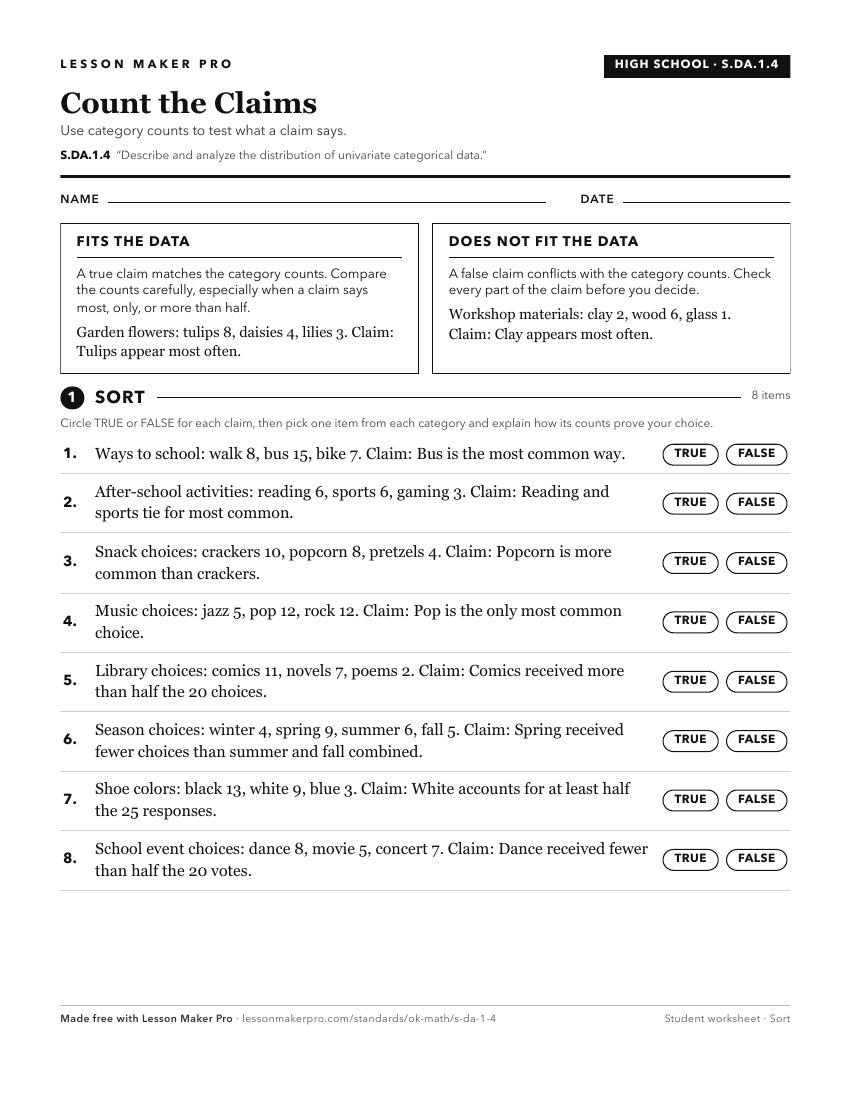
A ready-to-print activity worksheet aligned to S.DA.1.4, with an answer key for the teacher on its own page. No account needed.
PDF, US Letter, prints cleanly in black and white.
Download the worksheetKeep exploring
Related Standards
- S.DA.1.1
Summarize and represent the distribution for univariate quantitative data by describing and analyzing the shape of the distribution, the measures of center for ...
- S.DA.1
Use distributions of quantitative and categorical data to identify the key features of the data collected in context.
- K.D.1
Collect, organize, and interpret categorical data.
- S.Q.3
Identify differences between categorical and quantitative data.
Turn this exact standard into a lesson
Grade, subject, topic, and the complete standard are prefilled. Create one free, no account needed.
Also for this standard:Make a WorksheetMake a QuizMake a Sub Lesson