Oklahoma Math S.Q.3
Standard Cluster
Identify differences between categorical and quantitative data. Determine whether categorical or quantitative data is appropriate to answer a statistical question. Compare and contrast different potential graphical or visual representations given the same data set.
Oklahoma Academic Standards for Mathematics (2022)
Cluster contents
Standards in This Cluster
S.Q.3 is a cluster heading. These are the individual standards under it.
Teacher's field guide
What This Cluster Means
What Students Need to Do
- Students tell category labels from counts or measurements, even when a label is a number. They choose the kind of data needed to answer a question. They compare two graphs of the same data and explain what each shows clearly.
What Mastery Looks Like
- A student treats bus route numbers as categories and ride times as measurements. They collect route numbers to find the most common route and ride times to find a typical ride length. They explain why a dot plot shows repeated times more clearly than a box plot.
Common Misconceptions
- Students may treat bus route numbers as measurements because they contain digits. They may use a histogram for favorite foods or assume a box plot shows every value as clearly as a dot plot.
How to Assess It
- Exit ticket: For 'Which bus route is most common?' and 'How long are rides?' name the data type each question needs. For ride times 5, 10, 10, 15, 30, explain whether a dot plot or box plot better shows repeated times and why.
Lesson moves
Ways to Teach It
Hand out cards showing bus route numbers, ride times, and favorite lunches; have pairs sort them into category labels and measurements.
Draw a dot plot and box plot for ride times 5, 10, 10, 15, 15, 20, 20, 30; discuss which shows repeats.
Run a sort race: teams match favorite lunch, number of siblings, and bus route number to data types and suitable graphs.
Give students a school bus survey with routes and ride times; have them choose graphs for a report to the principal.
Free download
Printable S.Q.3 Worksheet
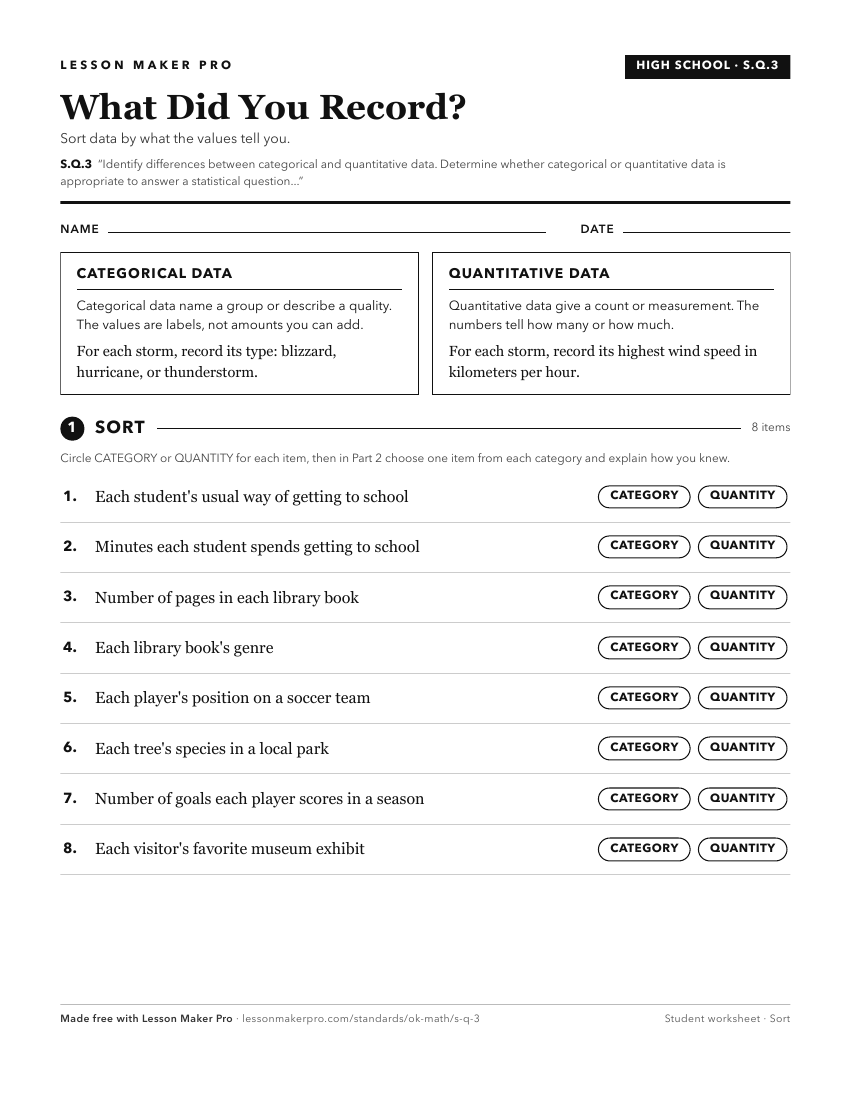
A ready-to-print activity worksheet aligned to S.Q.3, with an answer key for the teacher on its own page. No account needed.
PDF, US Letter, prints cleanly in black and white.
Download the worksheetKeep exploring
Related Standards
Turn this cluster into a lesson
Grade, subject, topic, and the complete cluster are prefilled. Create one free, no account needed.
Also for this cluster:Make a WorksheetMake a QuizMake a Sub Lesson