Oklahoma Math 4.D.1
Standard Cluster
Summarize, construct, and analyze data. Create and organize data on a frequency table or line plot marked with whole numbers and fractions using appropriate titles, labels, and units. Organize data sets to create tables, bar graphs, timelines, and Venn diagrams. The data may include benchmark fractions or decimals (1/4, 1/3, 1/2, 2/3, 3/4, 0.25, 0.50, 0.75). Solve one- and two-step problems by analyzing data in whole number, decimal, or fraction form in a frequency table and line plot.
Oklahoma Academic Standards for Mathematics (2022)
Cluster contents
Standards in This Cluster
4.D.1 is a cluster heading. These are the individual standards under it.
- 4.D.1.1
Create and organize data on a frequency table or line plot marked with whole numbers and fractions using appropriate titles, labels, and units.
- 4.D.1.2
Organize data sets to create tables, bar graphs, timelines, and Venn diagrams. The data may include benchmark fractions or decimals (1/4, 1/3, 1/2, 2/3, 3/4, 0....
- 4.D.1.3
Solve one- and two-step problems by analyzing data in whole number, decimal, or fraction form in a frequency table and line plot.
Teacher's field guide
What This Cluster Means
What Students Need to Do
- Students collect measurements, tally repeated values in a frequency table, and place them on a line plot. They label the data and answer one- and two-step questions using whole numbers, fractions, or decimals.
What Mastery Looks Like
- Students give a table or plot a clear title and label the units. They space number marks evenly, count each mark correctly, and use the data to find totals and differences.
Common Misconceptions
- Students may count the number labels on a line plot instead of the Xs. They may space quarter marks unevenly or add measurements when the question asks how many items there are.
How to Assess It
- Exit ticket: List six ribbon lengths in inches: 1/4, 1/2, 1/4, 3/4, 1/2, 1/4. Students draw a titled, labeled line plot, then find how many more ribbons measure 1/4 or 1/2 inch than 3/4 inch.
Lesson moves
Ways to Teach It
Give pairs eight precut paper strips with lengths in quarter-inch steps; have them measure, tally, and plot the lengths.
Draw a line plot with three Xs at 1/4 inch and five at 1/2 inch; ask which length appears more and why.
Put 0, 1/4, 1/2, 3/4, and 1 cards in a bag; students draw, plot an X, and compare counts.
Use this seven-day rainfall log, in inches: 0, 0.1, 0, 0.2, 0.1, 0, 0.3; tally days and find total rainfall.
Free download
Printable 4.D.1 Worksheet
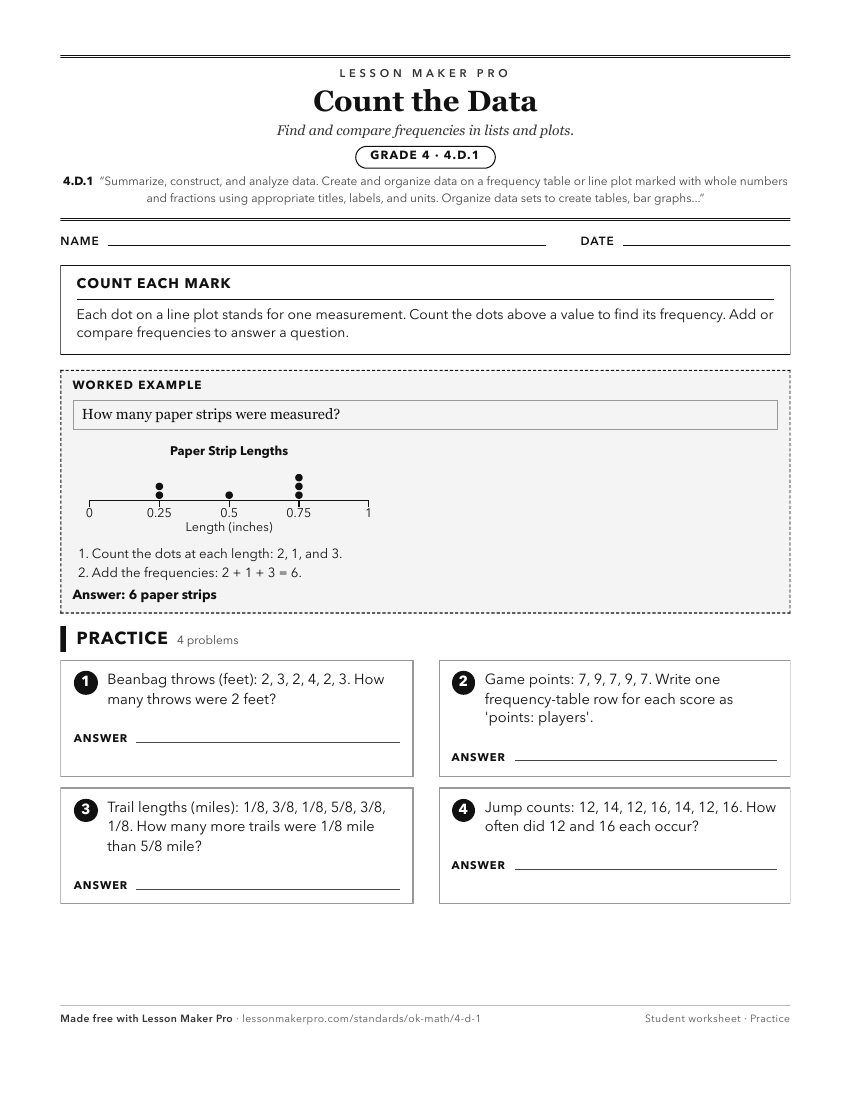
A ready-to-print activity worksheet aligned to 4.D.1, with an answer key for the teacher on its own page. No account needed.
PDF, US Letter, prints cleanly in black and white.
Download the worksheetKeep exploring
Related Standards
Turn this cluster into a lesson
Grade, subject, topic, and the complete cluster are prefilled. Create one free, no account needed.
Also for this cluster:Make a WorksheetMake a QuizMake a Sub Lesson