Oklahoma Math 4.D.1.2
The Standard
- 4.D.1
- Summarize, construct, and analyze data.
Organize data sets to create tables, bar graphs, timelines, and Venn diagrams. The data may include benchmark fractions or decimals (1/4, 1/3, 1/2, 2/3, 3/4, 0.25, 0.50, 0.75).
Oklahoma Academic Standards for Mathematics (2022)
Teacher's field guide
What This Standard Means
What Students Need to Do
- Students sort information into tables, bar graphs, timelines, and Venn diagrams. They label each display, put dates and number values in order, and check that counts match.
What Mastery Looks Like
- Given survey results and dated events, a student can make a counted table, an accurate bar graph, a timeline, and a Venn diagram. They place items shared by two groups in the overlap and order fractions or decimals correctly.
Common Misconceptions
- Students may put an item that belongs in both groups into only one Venn circle. They may draw bars that do not match their table, put dates out of order, or think 0.75 is less than 1/2.
How to Assess It
- Exit ticket: Ava picked art on Monday, Ben picked music on Tuesday, and Cal picked both on Wednesday. Draw a Venn diagram of their choices and a timeline of the dates.
Lesson moves
Ways to Teach It
Give pairs sticky notes labeled soccer, music, both, or neither; have them place the notes in a taped Venn diagram and count each region.
Show a class trip schedule and a tally of travel times. Ask, "Which belongs on a timeline, and which on a bar graph? Why?"
Play graph swap: partners turn a reading-time tally for 1/4, 1/2, and 3/4 hour into bar graphs, then compare counts.
Use the school lunch calendar to make a timeline of themed lunches, placing each lunch on its scheduled date.
Free download
Printable 4.D.1.2 Worksheet
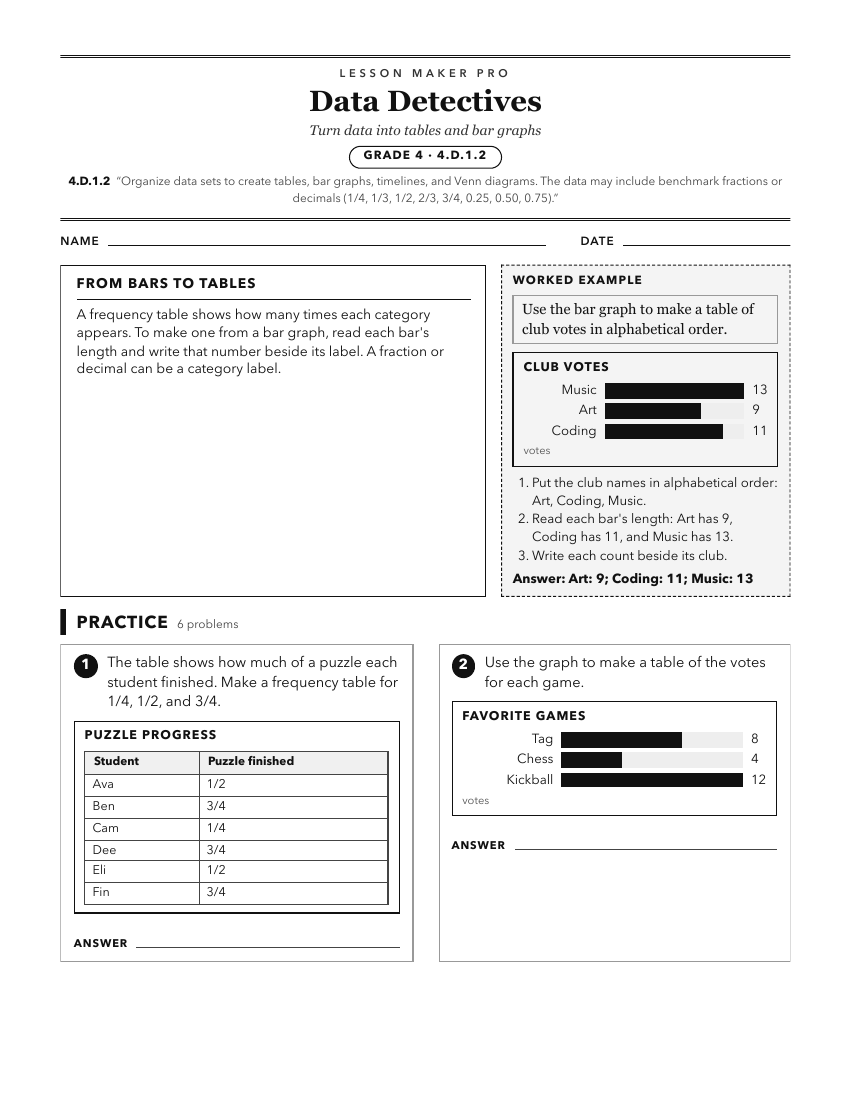
A ready-to-print activity worksheet aligned to 4.D.1.2, with an answer key for the teacher on its own page. No account needed.
PDF, US Letter, prints cleanly in black and white.
Download the worksheetKeep exploring
Related Standards
- 4.D.1.1
Create and organize data on a frequency table or line plot marked with whole numbers and fractions using appropriate titles, labels, and units.
- 5.D.1.2
Create and analyze line and double-bar graphs with increments of whole numbers, fractions, and decimals.
- 4.N.3.9
Compare and order benchmark fractions (0, 1/4, 1/3, 1/2, 2/3, 3/4, 1) and decimals (0, 0.25, 0.50, 0.75, 1.00) in a variety of representations.
- 1.D.1.1
Collect, sort, and organize data in up to three categories using representations (e.g., tally marks, tables, Venn diagrams).
Turn this exact standard into a lesson
Grade, subject, topic, and the complete standard are prefilled. Create one free, no account needed.
Also for this standard:Make a WorksheetMake a QuizMake a Sub Lesson