NY Next Generation Math NY-6.SP.5.a
The Standard
Report the number of observations.
New York State Next Generation Mathematics Learning Standards
Teacher's field guide
What This Standard Means
What Students Need to Do
- Students report the number of observations in a quantitative data set. They distinguish the observation count from the sum, range, or number of distinct values.
What Mastery Looks Like
- The student counts every data value once, including repeats. The reported sample size agrees with the frequencies in a table, dot plot, or histogram.
Common Misconceptions
- Students may count only unique values or add the measurements. They may miss repeated observations represented by stacked dots or frequencies.
How to Assess It
- Show a dot plot with repeated values. Ask students to report the number of observations and explain how the display confirms the count.
Lesson moves
Ways to Teach It
Count individual data cards before stacking repeated values into a dot plot, then recount the dots.
Ask students why repeated measurements each count as separate observations.
Play Sample Size Check with lists, frequency tables, dot plots, and histograms.
Count the recorded travel times in a class survey before summarizing the results.
Free download
Printable NY-6.SP.5.a Worksheet
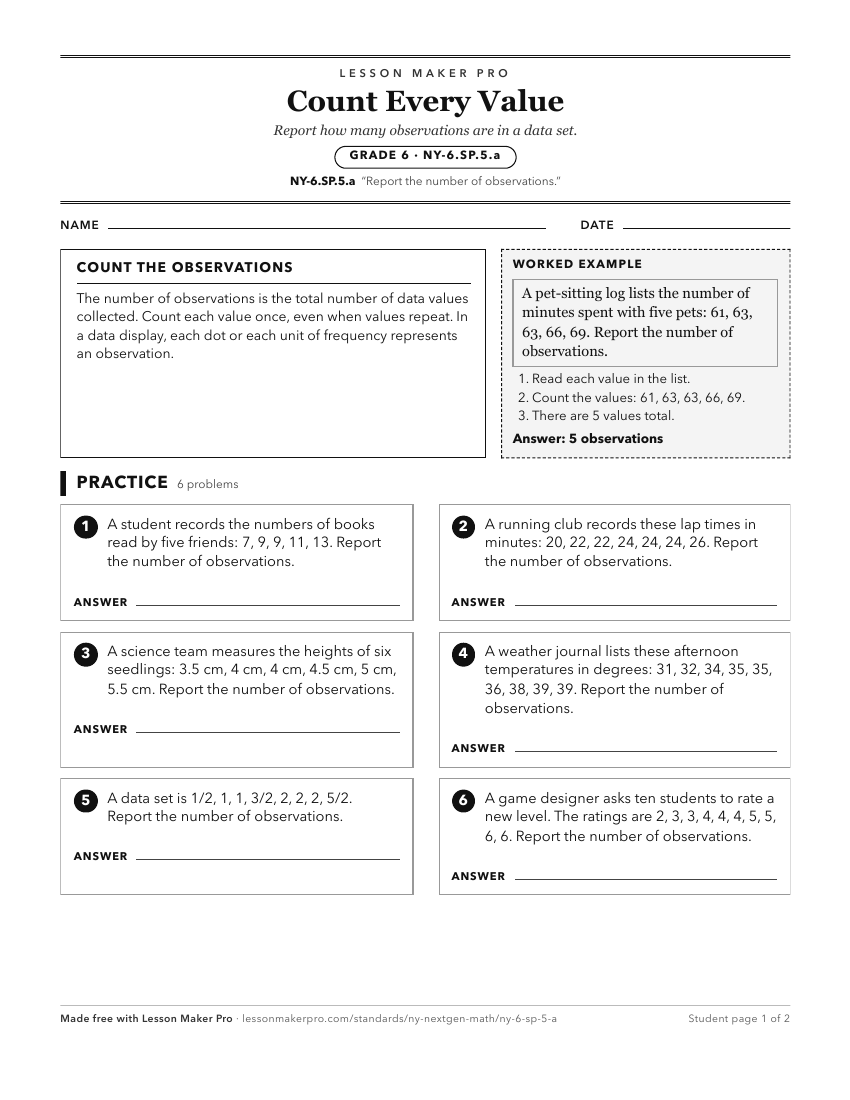
A ready-to-print activity worksheet aligned to NY-6.SP.5.a, with an answer key for the teacher on its own page. No account needed.
PDF, US Letter, prints cleanly in black and white.
Download the worksheetKeep exploring
Related Standards
- NY-K.CC.5.b
Given a number from 1–20, count out that many objects.
- NY-6.SP.4
Display quantitative data in plots on a number line, including dot plots, and histograms.
- NY-1.MD.4
Organize, represent, and interpret data with up to three categories; ask and answer questions about the total number of data points, how many in each category, ...
Turn this exact standard into a lesson
Grade, subject, topic, and the complete standard are prefilled. Create one free, no account needed.
Also for this standard:Make a WorksheetMake a QuizMake a Sub Lesson