NY Next Generation Math NY-6.SP.4
The Standard
Display quantitative data in plots on a number line, including dot plots, and histograms.
New York State Next Generation Mathematics Learning Standards
Teacher's field guide
What This Standard Means
What Students Need to Do
- Students display quantitative data on a number line using dot plots and histograms. They select scales and bins that represent all values accurately.
What Mastery Looks Like
- The student constructs a labeled dot plot or histogram with correct frequencies. The scale is consistent, histogram intervals do not overlap, and every observation is included once.
Common Misconceptions
- Students may leave gaps between histogram bins or count boundary values twice. They may treat a histogram like a bar graph of categories.
How to Assess It
- Give twelve numerical observations. Ask students to construct either a dot plot or histogram, justify the choice, and verify the total frequency.
Lesson moves
Ways to Teach It
Place sticky-note data values above a taped number line to build a class dot plot.
Ask students how changing histogram bin widths changes what patterns are visible.
Play Plot Repair by correcting scales, frequencies, and interval boundaries on flawed displays.
Display class travel-time data in a dot plot or histogram and label the units.
Free download
Printable NY-6.SP.4 Worksheet
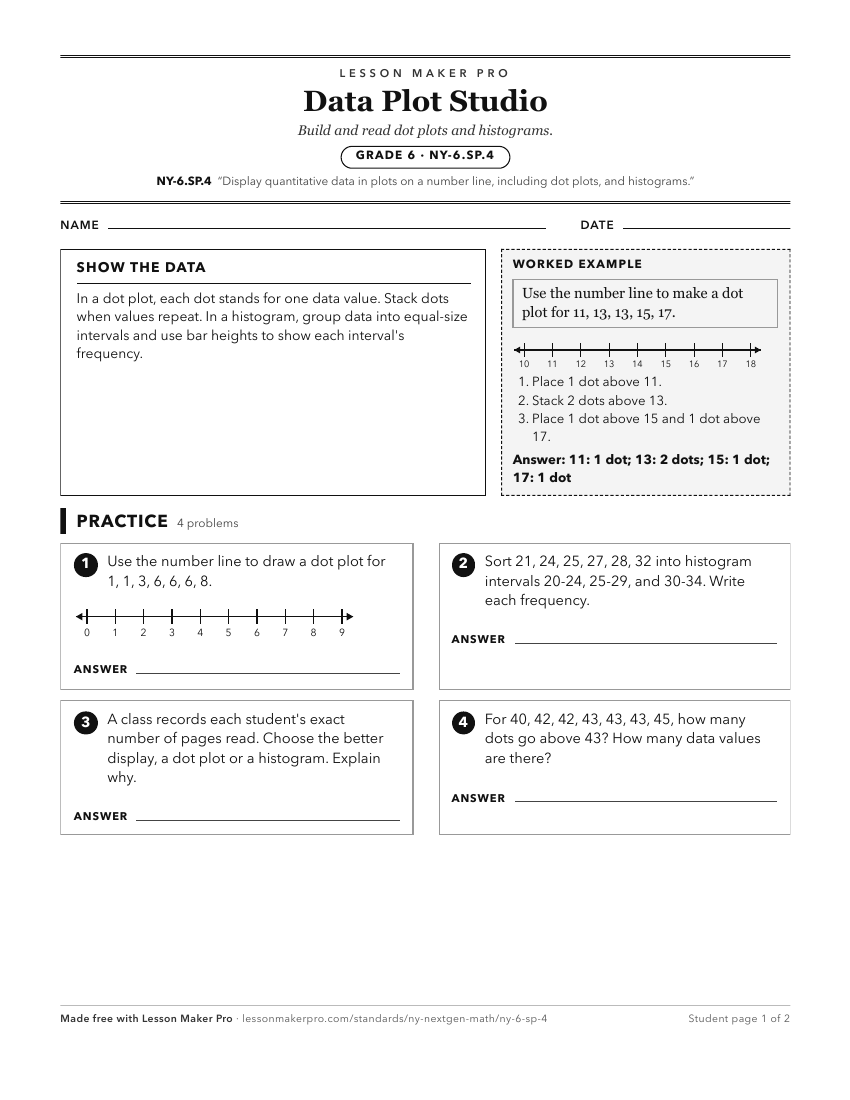
A ready-to-print activity worksheet aligned to NY-6.SP.4, with an answer key for the teacher on its own page. No account needed.
PDF, US Letter, prints cleanly in black and white.
Download the worksheetKeep exploring
Related Standards
- NY-6.SP.5
Summarize quantitative data sets in relation to their context.
- NY-4.MD.2.b
Represent measurement quantities using diagrams that feature a measurement scale, such as number lines.
- NY-3.MD.4
Generate measurement data by measuring lengths using rulers marked with halves and fourths of an inch. Show the data by making a line plot where the horizontal ...
- NY-2.MD.9
Generate measurement data by measuring lengths of several objects to the nearest whole unit, or by making repeated measurements of the same object. Present the ...
Turn this exact standard into a lesson
Grade, subject, topic, and the complete standard are prefilled. Create one free, no account needed.
Also for this standard:Make a WorksheetMake a QuizMake a Sub Lesson