NY Next Generation Math NY-1.MD.4
The Standard
Organize, represent, and interpret data with up to three categories; ask and answer questions about the total number of data points, how many in each category, and how many more or less are in one category than in another.
New York State Next Generation Mathematics Learning Standards
Teacher's field guide
What This Standard Means
What Students Need to Do
- Students organize data into no more than three categories and represent the counts clearly. They answer questions about category counts, the total, and how many more or fewer one category has than another.
What Mastery Looks Like
- A student sorts pet choices into cats, dogs, and fish and records 6, 4, and 2 responses. The student finds 12 responses in all and explains that cats received 2 more votes than dogs.
Common Misconceptions
- Students may place one response in two categories or leave a response uncounted. They may compare categories by appearance rather than matching or subtracting their counts.
How to Assess It
- Give students 10 picture cards from three categories to sort and represent. Ask how many are in each category, how many total, and one comparison question.
Lesson moves
Ways to Teach It
Sort classroom objects into three labeled hoops, count each group, and build a matching picture or tally representation.
Ask students which two categories are easiest to compare and how the representation supports their answer.
Play data-question match by pairing three-category displays with correct total, category, and comparison answers.
Survey three recess choices and use the class data to decide which activity needs the most equipment.
Free download
Printable NY-1.MD.4 Worksheet
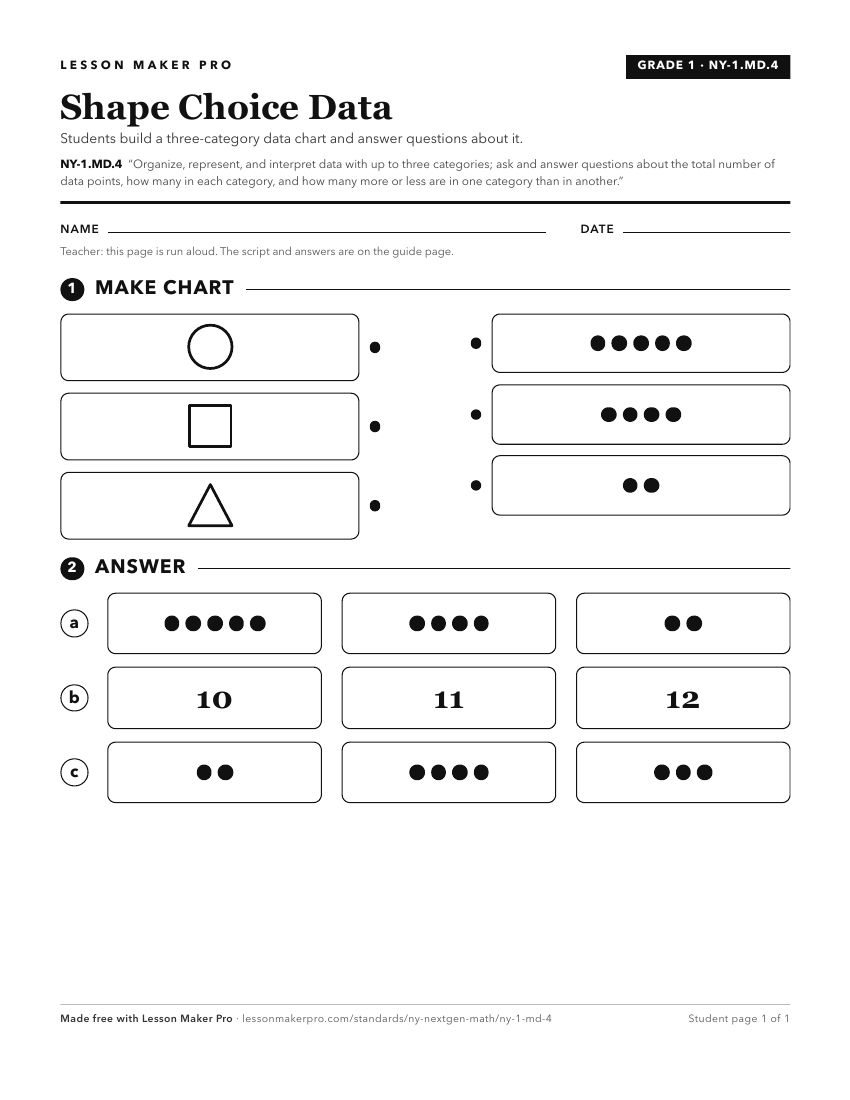
A ready-to-print activity worksheet aligned to NY-1.MD.4, with an answer key for the teacher on its own page. No account needed.
PDF, US Letter, prints cleanly in black and white.
Download the worksheetKeep exploring
Related Standards
- NY-2.MD.10
Draw a picture graph and a bar graph (with single-unit scale) to represent a data set with up to four categories. Solve simple put-together, take-apart, and com...
- NY-3.MD.3
Draw a scaled picture graph and a scaled bar graph to represent a data set with several categories. Solve one-and two-step "how many more" and "how many less" p...
Turn this exact standard into a lesson
Grade, subject, topic, and the complete standard are prefilled. Create one free, no account needed.
Also for this standard:Make a WorksheetMake a QuizMake a Sub Lesson