NY Next Generation Math NY-6.SP.2
The Standard
Understand that a set of quantitative data collected to answer a statistical question has a distribution which can be described by its center, spread, and overall shape.
New York State Next Generation Mathematics Learning Standards
Teacher's field guide
What This Standard Means
What Students Need to Do
- Students describe a quantitative data distribution by its center, spread, and overall shape. They choose a dot plot or histogram and discuss symmetry, clusters, peaks, gaps, or other patterns.
What Mastery Looks Like
- The student identifies a reasonable center, describes how values spread, and names visible shape features in context. The chosen display fits the data and supports the description.
Common Misconceptions
- Students may describe only the highest bar or dot as the center. They may call a display symmetric without checking both sides or ignore meaningful gaps and clusters.
How to Assess It
- Give a small data set and its dot plot. Ask students to describe center, spread, shape, one cluster or gap, and why a dot plot fits.
Lesson moves
Ways to Teach It
Arrange data cards on a floor number line to form a human dot plot and describe its shape.
Ask students how a cluster and a gap affect the story told by a distribution.
Play Distribution Description Match with dot plots, histograms, and center-spread-shape summaries.
Graph daily travel times and explain peaks or gaps using the commute context.
Free download
Printable NY-6.SP.2 Worksheet
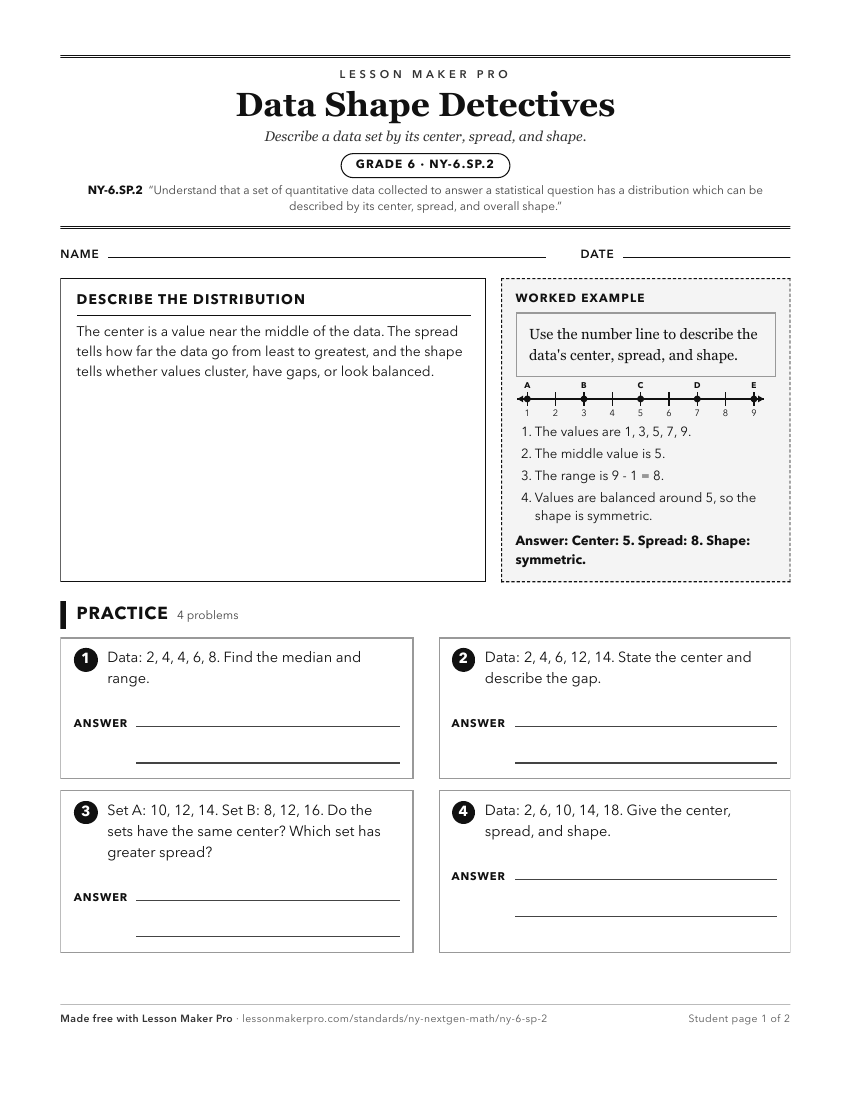
A ready-to-print activity worksheet aligned to NY-6.SP.2, with an answer key for the teacher on its own page. No account needed.
PDF, US Letter, prints cleanly in black and white.
Download the worksheetKeep exploring
Related Standards
- NY-6.SP.3
Recognize that a measure of center for a quantitative data set summarizes all of its values with a single number while a measure of variation describes how its ...
- NY-7.SP.4
Use measures of center and measures of variability for quantitative data from random samples or populations to draw informal comparative inferences about the po...
- NY-6.SP.5.c
Calculate range and measures of center, as well as describe any overall pattern and any striking deviations from the overall pattern with reference to the conte...
- NY-6.SP.5.d
Relate the range and the choice of measures of center to the shape of the data distribution and the context in which the data were gathered.
Turn this exact standard into a lesson
Grade, subject, topic, and the complete standard are prefilled. Create one free, no account needed.
Also for this standard:Make a WorksheetMake a QuizMake a Sub Lesson