NY Next Generation Math AI-S.ID.3
The Standard
Interpret differences in shape, center, and spread in the context of the data sets, accounting for possible effects of extreme data points (outliers).
New York State Next Generation Mathematics Learning Standards
Teacher's field guide
What This Standard Means
What Students Need to Do
- Students compare Algebra I data distributions by shape, center, and spread in context. They account for how extreme values can affect summaries and interpretations.
What Mastery Looks Like
- The student describes each distribution using appropriate measures and explains differences with units and context. The effect of an outlier on mean, median, range, or spread is supported by evidence.
Common Misconceptions
- Students may compare only centers, describe shape without context, or assume every extreme value is an error. They may claim an outlier changes median and mean equally.
How to Assess It
- Give two box plots and dot plots of task times, one with an outlier. Ask students to compare shape, center, spread, and the outlier's effect.
Lesson moves
Ways to Teach It
Build two dot plots with counters, then move one counter outward and recalculate center and spread summaries.
Ask students which comparison measure is most resistant to an extreme value and why.
Play distribution comparison with cards for shape, center, spread, outliers, and contextual conclusions.
Compare two teams' performance or two neighborhoods' measurements using distributions and contextual units.
Free download
Printable AI-S.ID.3 Worksheet
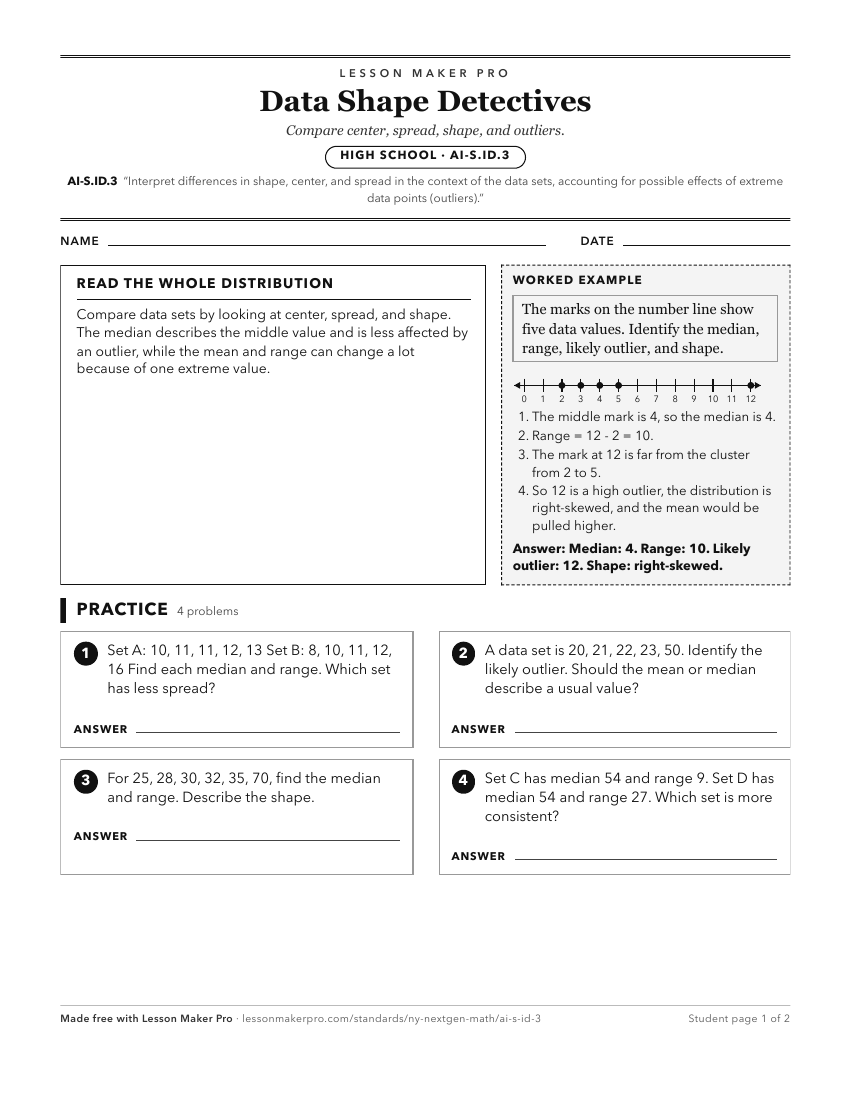
A ready-to-print activity worksheet aligned to AI-S.ID.3, with an answer key for the teacher on its own page. No account needed.
PDF, US Letter, prints cleanly in black and white.
Download the worksheetKeep exploring
Related Standards
- NY-7.SP.1
Construct and interpret box-plots, find the interquartile range, and determine if a data point is an outlier.
- NY-6.SP.5.c
Calculate range and measures of center, as well as describe any overall pattern and any striking deviations from the overall pattern with reference to the conte...
- NY-6.SP.5.d
Relate the range and the choice of measures of center to the shape of the data distribution and the context in which the data were gathered.
- NY-6.SP.2
Understand that a set of quantitative data collected to answer a statistical question has a distribution which can be described by its center, spread, and overa...
Turn this exact standard into a lesson
Grade, subject, topic, and the complete standard are prefilled. Create one free, no account needed.
Also for this standard:Make a WorksheetMake a QuizMake a Sub Lesson