NY Next Generation Math NY-7.SP.1
The Standard
Construct and interpret box-plots, find the interquartile range, and determine if a data point is an outlier.
New York State Next Generation Mathematics Learning Standards
Teacher's field guide
What This Standard Means
What Students Need to Do
- Students order a data set, find the quartiles, and build a box plot. They use the interquartile range to identify outliers and interpret the plot.
What Mastery Looks Like
- A student calculates Q1, the median, Q3, and the interquartile range, then constructs a box plot for a data set without outliers. Given a box plot that shows an outlier, the student uses the interquartile range to identify and interpret the unusual value.
Common Misconceptions
- Students may confuse the median with a quartile or subtract Q3 from Q1. They may assume every extreme-looking value is an outlier without checking it against the interquartile range.
How to Assess It
- Give students the data set 2, 3, 4, 5, 6, 7, 8 and ask them to construct a box plot and find the interquartile range. Then show a separate box plot with a candidate outlier and ask them to determine and interpret it.
Lesson moves
Ways to Teach It
Write data values on index cards, arrange them in order, and fold the row to locate the median and quartiles.
Ask, "How can two box plots have the same median but very different interquartile ranges?"
Play an outlier-check game where teams calculate both fences for a provided box plot and classify candidate values as outliers or not.
Use a box plot of daily travel times to describe a typical commute, the middle spread, and any unusual day.
Free download
Printable NY-7.SP.1 Worksheet
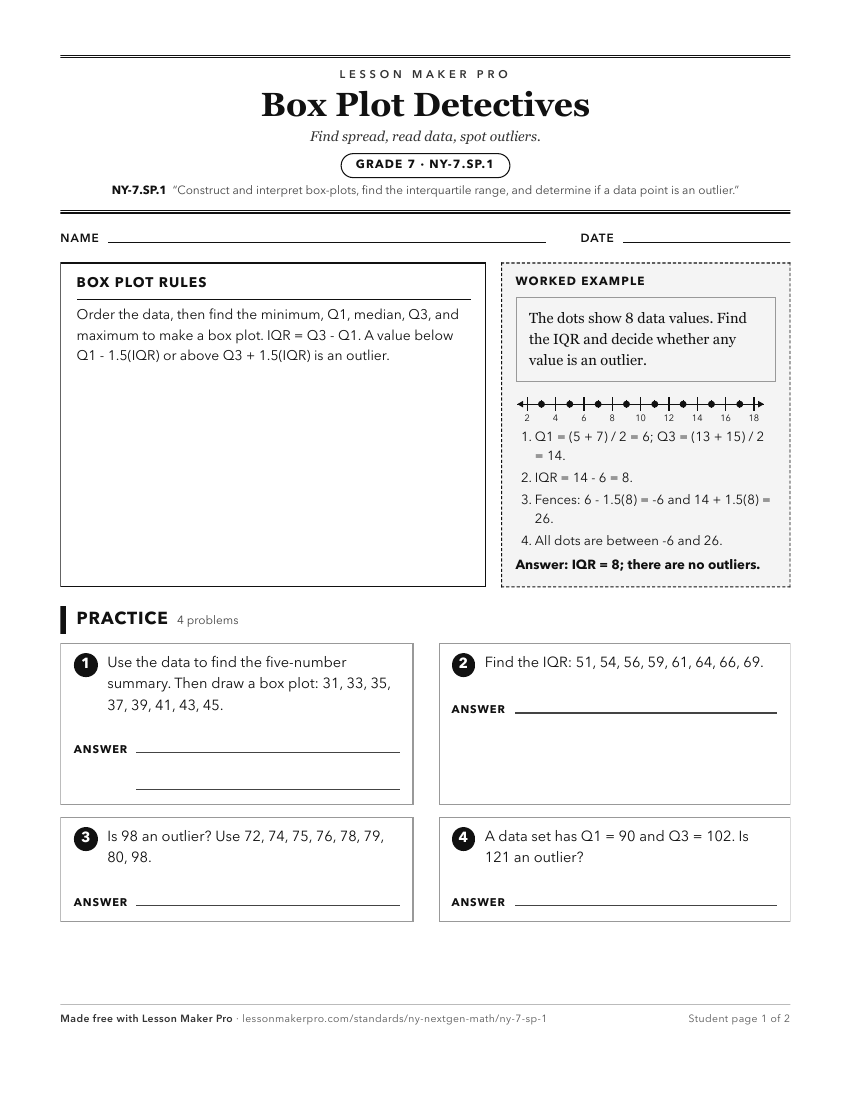
A ready-to-print activity worksheet aligned to NY-7.SP.1, with an answer key for the teacher on its own page. No account needed.
PDF, US Letter, prints cleanly in black and white.
Download the worksheetKeep exploring
Related Standards
- NY-7.SP.3
Informally assess the degree of visual overlap of two quantitative data distributions.
- NY-6.SP.4
Display quantitative data in plots on a number line, including dot plots, and histograms.
- NY-6.SP.5.c
Calculate range and measures of center, as well as describe any overall pattern and any striking deviations from the overall pattern with reference to the conte...
- NY-8.SP.1
Construct and interpret scatter plots for bivariate measurement data to investigate patterns of association between two quantities. Describe patterns such as cl...
Turn this exact standard into a lesson
Grade, subject, topic, and the complete standard are prefilled. Create one free, no account needed.
Also for this standard:Make a WorksheetMake a QuizMake a Sub Lesson