Montana Math MT.PLUS.DATA.NORM.3
The Standard
Estimate areas under a normal curve to solve problems in context, using calculators, spreadsheets, and tables as appropriate.
2026 Montana Mathematics Content Standards · Data Reasoning
Teacher's field guide
What This Standard Means
What Students Need to Do
- Students sketch a normal curve and shade the part named in a question. They use a table, calculator, or spreadsheet to estimate the shaded share and describe it in context.
What Mastery Looks Like
- Given a mean of 100 and a standard deviation of 15, a student can estimate that about 2.5% of values exceed 130. They shade the right tail and explain what that percent counts.
Common Misconceptions
- Students may shade below a cutoff when asked for the share above it. Some treat the curve’s height as the probability, or think 95% lies on one side of the mean.
How to Assess It
- Exit ticket: Scores are approximately normal with mean 70 and standard deviation 5. Sketch and shade scores above 80, then estimate the percent and explain what it means.
Lesson moves
Ways to Teach It
Hand out paper bell curves marked with mean 70 and standard deviation 5; students shade 70 to 75 and label its approximate 34% area.
Ask, “Why do scores above 80 make up about 2.5% when the mean is 70 and the standard deviation is 5?”
Give teams cutoff cards for a normal model with mean 70 and standard deviation 5; they calculate tail areas and match them to percent cards.
For normally distributed bolt lengths with mean 10 mm and standard deviation 0.2 mm, estimate the share outside 9.6 to 10.4 mm.
Free download
Printable MT.PLUS.DATA.NORM.3 Worksheet
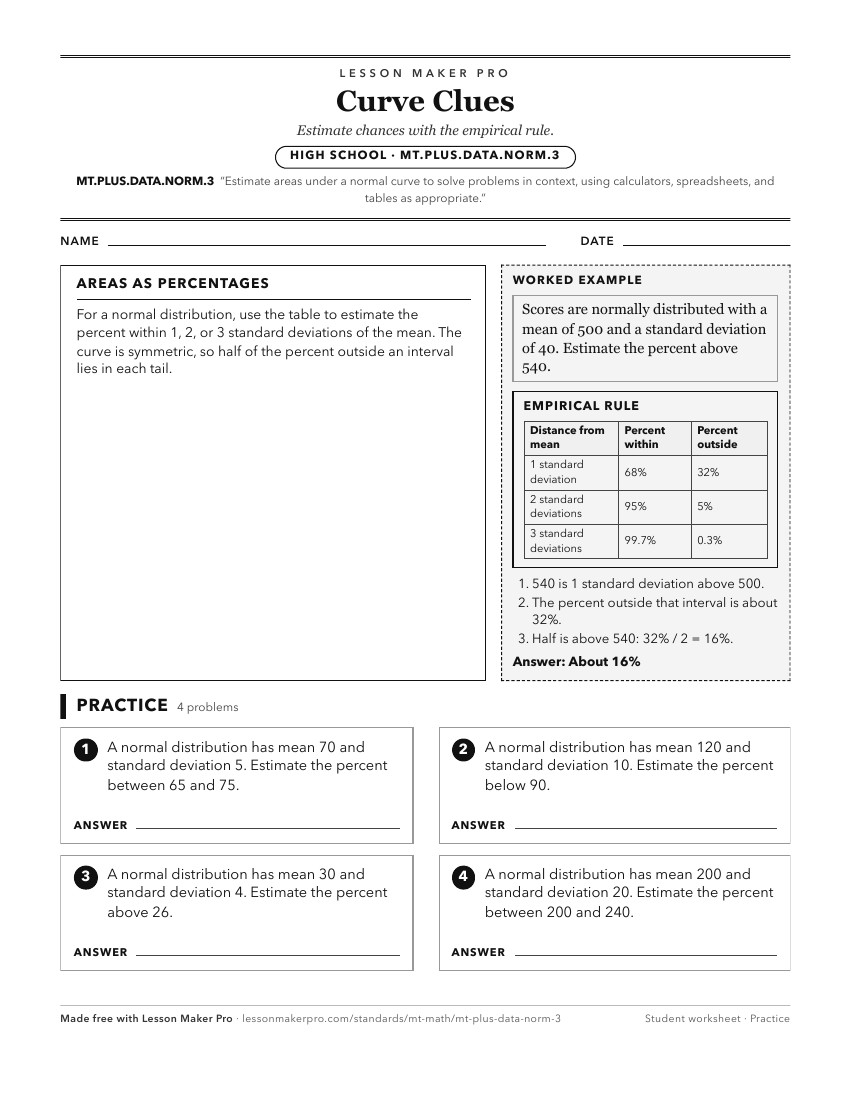
A ready-to-print activity worksheet aligned to MT.PLUS.DATA.NORM.3, with an answer key for the teacher on its own page. No account needed.
PDF, US Letter, prints cleanly in black and white.
Download the worksheetKeep exploring
Related Standards
- MT.PLUS.DATA.NORM.2
Use technology to find the mean and standard deviation of a normally distributed data set and apply the empirical rule to estimate population percentages.
- MT.CORE.DATA.INT.4
Interpret differences in the shape, center, and spread of quantitative data distributions, in context, accounting for possible effects of outliers on measures o...
Turn this exact standard into a lesson
Grade, subject, topic, and the complete standard are prefilled. Create one free, no account needed.
Also for this standard:Make a WorksheetMake a QuizMake a Sub Lesson