Montana Math MT.PLUS.DATA.DES.2.b
The Standard
- MT.PLUS.DATA.DES.2
- Describe differences between randomly selecting samples and randomly assigning subjects to experimental treatment groups in terms of inferences drawn regarding a population versus regarding cause and effect by: Explaining the consequences, due to uncontrolled variables, of non-randomized assignment of subjects to groups in experiments, and Evaluating where bias, including sampling, response, or nonresponse bias, may occur in surveys, and whether results are representative of the population of interest.
Describe differences between randomly selecting samples and randomly assigning subjects to experimental treatment groups in terms of inferences drawn regarding a population versus regarding cause and effect by: Evaluating where bias, including sampling, response, or nonresponse bias, may occur in surveys, and whether results are representative of the population of interest.
2026 Montana Mathematics Content Standards · Data Reasoning
Teacher's field guide
What This Standard Means
What Students Need to Do
- Students examine who was invited to take a survey, who answered, and how the questions were worded. They decide whether the results can describe the population of interest. They distinguish random selection from random assignment.
What Mastery Looks Like
- Given a poll, students identify sampling, response, or nonresponse bias and explain how it could change the results. They know random selection can support claims about a population, while random assignment can support cause-and-effect claims.
Common Misconceptions
- Students may think a large sample fixes a biased selection method. They may treat an online poll as random or assume random assignment makes survey answers representative.
How to Assess It
- Exit ticket: A school emails all students a lunch survey, and 40 reply. If 32 like the food, can the school claim 80% of students like it? Name a possible bias and explain whether randomly assigning lunch options would fix it.
Lesson moves
Ways to Teach It
Draw 10 names from a class roster, ask whether they prefer apples or bananas, then compare their answers with answers from volunteers.
Ask, 'Would randomly assigning basketball players to two groups make their school sports survey represent every student? Why not?'
Give pairs four index cards with poll scenarios, including a loaded question and a low-response survey, and have them sort the cards by bias.
Show an online news poll and ask students to write who could answer it and whose views might be missing.
Free download
Printable MT.PLUS.DATA.DES.2.b Worksheet
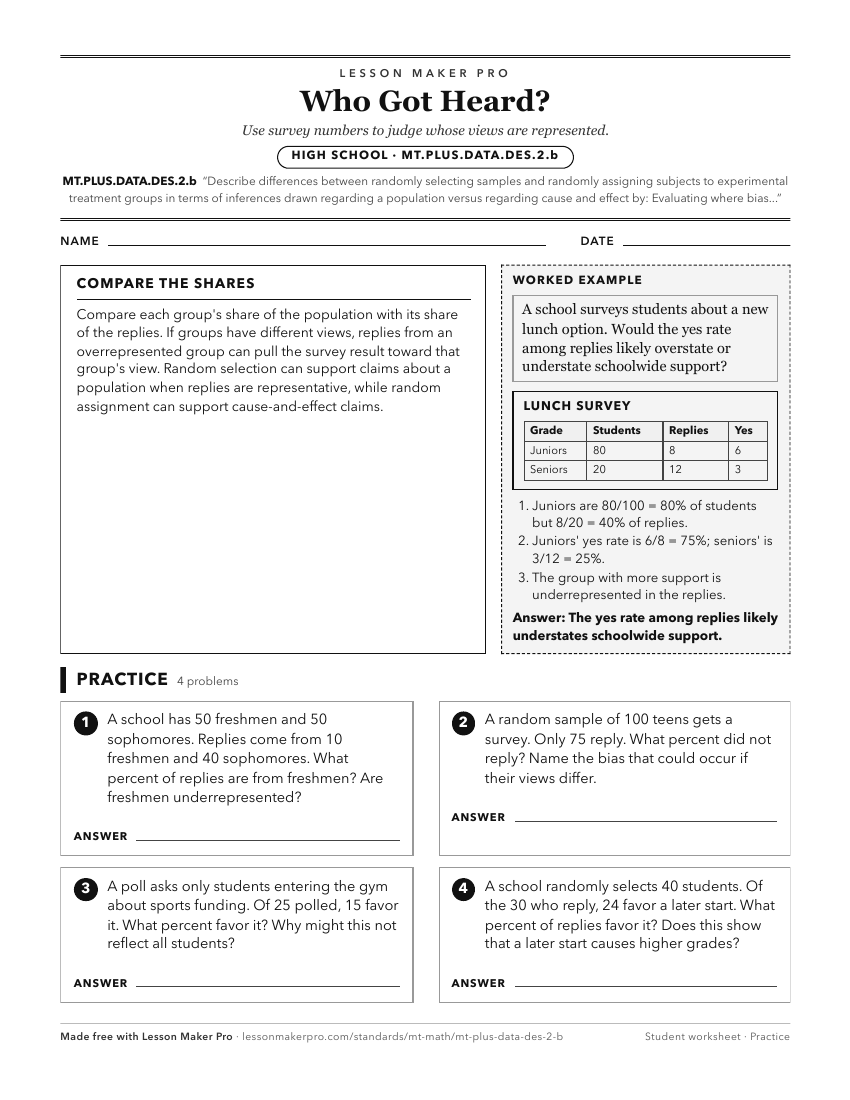
A ready-to-print activity worksheet aligned to MT.PLUS.DATA.DES.2.b, with an answer key for the teacher on its own page. No account needed.
PDF, US Letter, prints cleanly in black and white.
Download the worksheetKeep exploring
Related Standards
- MT.7.SP.2
Use data from a random sample to draw inferences about a population with an unknown characteristic of interest and generate or simulate multiple samples of the ...
- MT.7.SP.1
Understand statistics can be used to gain information about a population by examining a representative sample of the population.
- MT.PLUS.DATA.INF.2
Estimate a population parameter from a representative sample by: Understanding why the sample statistic is the best estimate for the associated population param...
- MT.PLUS.DATA.DES.2
Describe differences between randomly selecting samples and randomly assigning subjects to experimental treatment groups in terms of inferences drawn regarding ...
Turn this exact standard into a lesson
Grade, subject, topic, and the complete standard are prefilled. Create one free, no account needed.
Also for this standard:Make a WorksheetMake a QuizMake a Sub Lesson