Montana Math MT.CORE.DATA.INT.2
The Standard
Represent the distribution of univariate quantitative data with plots on the real number line, choosing a format most appropriate to the data set, and representing the distribution of bivariate quantitative data with a scatter plot.
2026 Montana Mathematics Content Standards · Data Reasoning and Probability
Teacher's field guide
What This Standard Means
What Students Need to Do
- Students choose a dot plot, histogram, or box plot to show one set of numbers. For paired measurements, they place each pair as one point on a scatter plot. They label axes and use scales that show the data clearly.
What Mastery Looks Like
- A student can group 25 test scores into sensible histogram intervals and show the count in each interval. They can plot each student's study hours and score as one point. They can explain why a dot plot shows repeated values better in a short list.
Common Misconceptions
- Students may put names or days on a number line instead of numerical values. They may plot paired measurements as two separate lists rather than one point per pair. They may read histogram bar heights as data values rather than counts.
How to Assess It
- Give students five (study hours, quiz score) pairs: (1, 62), (2, 68), (2, 74), (3, 78), (4, 86). Ask them to choose and draw a number-line plot of the scores, draw an hours-versus-scores scatter plot, and explain their first plot choice.
Lesson moves
Ways to Teach It
Give pairs five pencils to measure in centimeters and sticky dots to place on a taped number line; have them copy the dot plot.
Show a dot plot, histogram, and box plot of the same 20 quiz scores; ask which shows repeated scores and which shows the median.
Give teams cards with five temperatures or five height-and-arm-span pairs; have them race to sketch a dot plot or scatter plot for each card.
Print seven days of local high and low temperatures; students make a high-temperature dot plot and a high-versus-low scatter plot.
Free download
Printable MT.CORE.DATA.INT.2 Worksheet
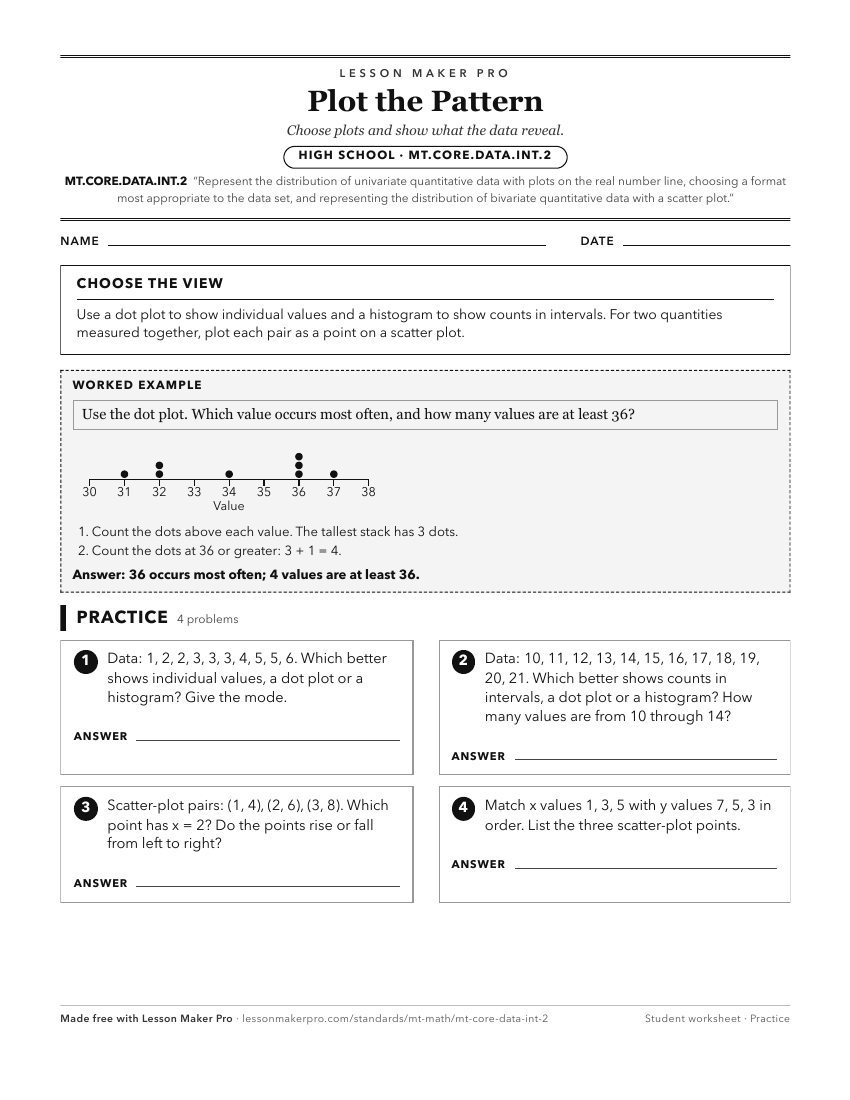
A ready-to-print activity worksheet aligned to MT.CORE.DATA.INT.2, with an answer key for the teacher on its own page. No account needed.
PDF, US Letter, prints cleanly in black and white.
Download the worksheetKeep exploring
Related Standards
- MT.CORE.DATA.INT.6.a
Using technology strategically, represent two quantitative data distributions on scatter plots,
- MT.CORE.DATA.INT.6
Analyze the relationship between two quantitative data distributions in context that have a linear association. This standard should incorporate cultural contex...
- MT.6.SP.4
Display numerical data in plots on a number line, including dot plots, histograms, and box plots, and describe any overall pattern and any striking deviations f...
Turn this exact standard into a lesson
Grade, subject, topic, and the complete standard are prefilled. Create one free, no account needed.
Also for this standard:Make a WorksheetMake a QuizMake a Sub Lesson