Mississippi Science L.6.3.3
The Standard
- L.6.3
- Students will demonstrate an understanding of the relationships between survival, environmental changes, and diversity as they relate to the interactions of organisms, populations, and the environment.
Analyze cause and effect relationships to explore how changes in the physical environment (limiting factors, natural disasters) can lead to population changes within an ecosystem.
2026 Mississippi College- and Career-Readiness Standards for Science · Ecology and Interdependence
Teacher's field guide
What This Standard Means
What Students Need to Do
- Students trace how droughts, floods, or changes in resources affect the number of organisms in a population. They use population counts to support their explanations.
What Mastery Looks Like
- Given rainfall and rabbit counts, a student explains how less rain can mean less grass and fewer rabbits. They use the counts as evidence and recognize that some rabbits may have moved away.
Common Misconceptions
- Students may assume a disaster affects every species the same way. They may also treat a lower count as proof that animals died, without considering migration or fewer births.
How to Assess It
- Show students this data: pond depth drops from 50 cm to 10 cm, and frog counts fall from 40 to 18. Ask them to explain the link and give one reason for the lower count besides deaths.
Lesson moves
Ways to Teach It
Give pairs 12 bean fish and 12 blue paper water spaces, remove six spaces, and recount fish using a one-fish-per-space rule.
Have students write how a dried pond could change frog numbers, using the words water, survival, and migration.
Play a card match with drought, fewer plants, less rabbit food, and fewer rabbits, then have pairs justify their order.
Show a local rainfall chart and a pond photo, then ask students to predict how a dry month could affect frogs.
Free download
Printable L.6.3.3 Worksheet
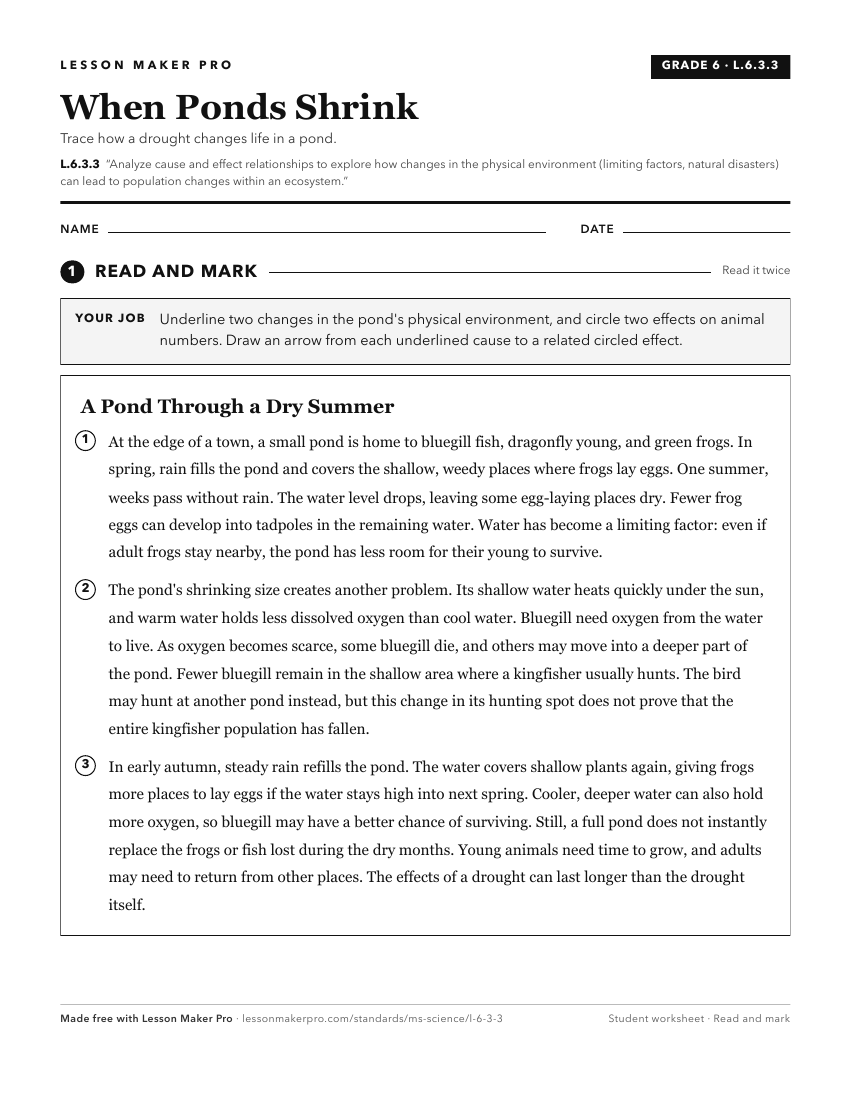
A ready-to-print activity worksheet aligned to L.6.3.3, with an answer key for the teacher on its own page. No account needed.
PDF, US Letter, prints cleanly in black and white.
Download the worksheetKeep exploring
Related Standards
- ENV.1.6
Use mathematics, graphics, and informational text to determine how population density-dependent and density-independent limiting factors affect populations and ...
- ENV.1.7
Analyze and interpret quantitative data to construct explanations of how the carrying capacity of an ecosystem may change as the availability of resources chang...
- BIO.5.6
Analyze and interpret population data to define limiting factors, both density-dependent and density-independent. Use graphical representations (growth curves) ...
- ENV.1.2
Evaluate evidence in nonfiction text to explain how biological or physical changes within biomes affect populations and communities and how changing conditions ...
Turn this exact standard into a lesson
Grade, subject, topic, and the complete standard are prefilled. Create one free, no account needed.
Also for this standard:Make a WorksheetMake a QuizMake a Sub Lesson