Mississippi Science ENV.1.7
The Standard
- ENV.1
- Students will investigate the interdependence of diverse living organisms and their interactions with the components of the biosphere.
Analyze and interpret quantitative data to construct explanations of how the carrying capacity of an ecosystem may change as the availability of resources changes.
2026 Mississippi College- and Career-Readiness Standards for Science · Biosphere and Biodiversity
Teacher's field guide
What This Standard Means
What Students Need to Do
- Students use numbers to estimate how many organisms a habitat can support over time. They explain how changes in food, water, or space can raise or lower that limit.
What Mastery Looks Like
- Given yearly food supplies and the food each rabbit needs, a student calculates how many rabbits the habitat can support each year. They use the figures to explain why the limit can fall before the rabbit count falls.
Common Misconceptions
- Students may mistake the current population for the maximum the habitat can support. They may think a food shortage removes animals right away, or that adding food always raises the limit even when water is scarce.
How to Assess It
- Assuming food is the only limit, a pond's monthly insect food drops from 400 kg to 250 kg; each fish needs 5 kg monthly. Calculate how many fish the pond can support before and after, and explain the change.
Lesson moves
Ways to Teach It
Give pairs 24 beans as food and 12 paper rabbits; require two beans per rabbit each round, then repeat with 12 beans.
Show food falling from 400 kg to 250 kg while fish remain at 80; ask students to explain what changes first.
Play a card match: pair monthly food supplies with fish limits when each fish needs 5 kg of food.
Use a park's 6,000 kg of winter browse, then 4,500 kg after drought; at 150 kg per deer, calculate deer supported.
Free download
Printable ENV.1.7 Worksheet
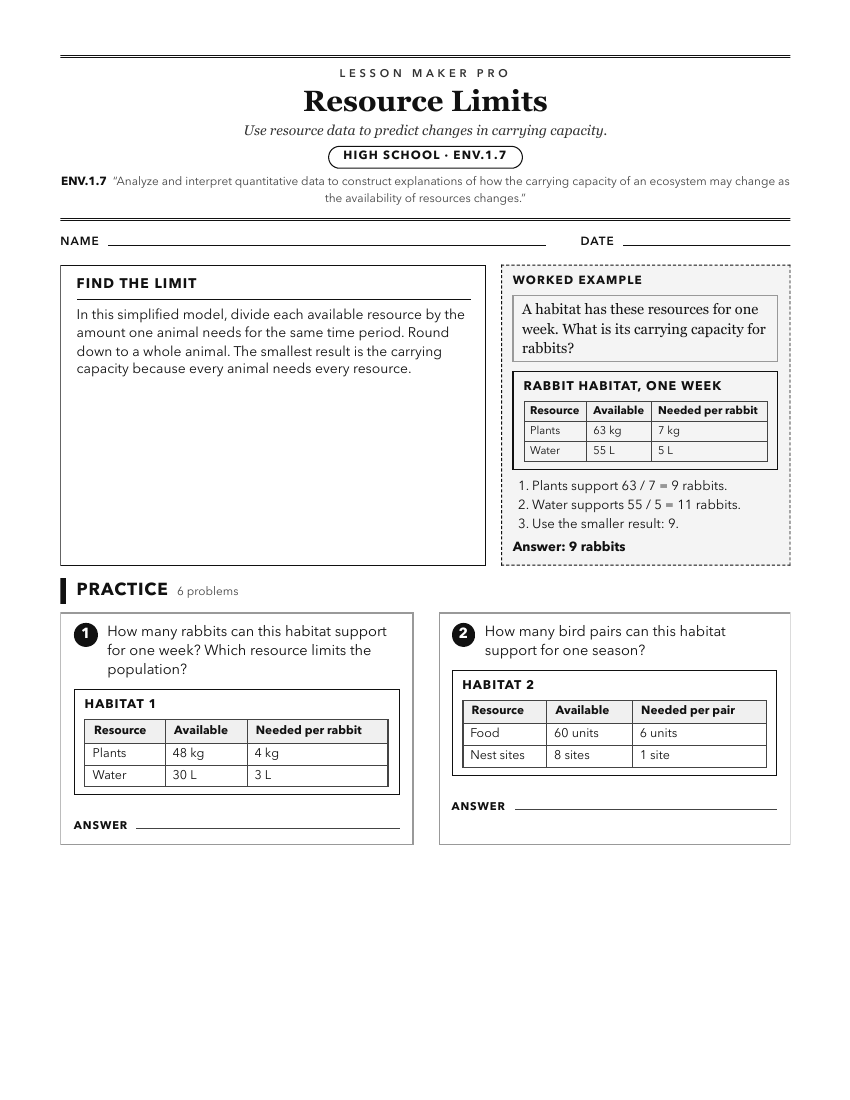
A ready-to-print activity worksheet aligned to ENV.1.7, with an answer key for the teacher on its own page. No account needed.
PDF, US Letter, prints cleanly in black and white.
Download the worksheetKeep exploring
Related Standards
- BIO.5.3
Analyze and interpret quantitative data to construct an explanation for the effects of greenhouse gases on the carbon dioxide cycle and global climate.
- BIO.5.6
Analyze and interpret population data to define limiting factors, both density-dependent and density-independent. Use graphical representations (growth curves) ...
- FB.6.3
Obtain, evaluate, and communicate information to explain relationships that exist between abiotic and biotic components of an ecosystem. Explain how changes in ...
- L.6.3.3
Analyze cause and effect relationships to explore how changes in the physical environment (limiting factors, natural disasters) can lead to population changes w...
Turn this exact standard into a lesson
Grade, subject, topic, and the complete standard are prefilled. Create one free, no account needed.
Also for this standard:Make a WorksheetMake a QuizMake a Sub Lesson