Mississippi Science BIO.5.6
The Standard
- BIO.5
- Students will Investigate and evaluate the interdependence of living organisms and their environment.
Analyze and interpret population data to define limiting factors, both density-dependent and density-independent. Use graphical representations (growth curves) to illustrate the carrying capacity within ecosystems.
2026 Mississippi College- and Career-Readiness Standards for Science · Interdependence of Organisms and Their Environments
Teacher's field guide
What This Standard Means
What Students Need to Do
- Students graph population counts over time and look for where growth slows. They use the data to explain which pressures get worse as a population grows and which affect it regardless of size.
What Mastery Looks Like
- A student can estimate the population a habitat supports over time and point to data that backs up the estimate. They can explain why crowded nesting sites affect a large population more, while a hard freeze can affect populations of any size.
Common Misconceptions
- Students may call the highest point on a graph the carrying capacity, even if numbers quickly fall. They may think any event that kills many organisms depends on population density, or that a population must stay at exactly one number.
How to Assess It
- Graph rabbit counts of 10, 24, 39, 48, 50, 49, and 51 across seven years. Mark the approximate long-term population, then classify crowded burrows and a hard freeze by whether their effects depend on population size.
Lesson moves
Ways to Teach It
Put 5 and 20 counters on equal-size paper squares, count touching pairs, and compare how easily disease could spread.
Show a graph that levels near 80 fish and ask students to write what evidence supports 80 as an estimate, not a fixed limit.
Give pairs four cards: crowded nests, contagious disease, frost, and wildfire; have them sort the cards by whether effects increase with population size.
Graph hypothetical park deer counts of 20, 38, 55, 63, and 65 over five years, then discuss how limited food might slow growth.
Free download
Printable BIO.5.6 Worksheet
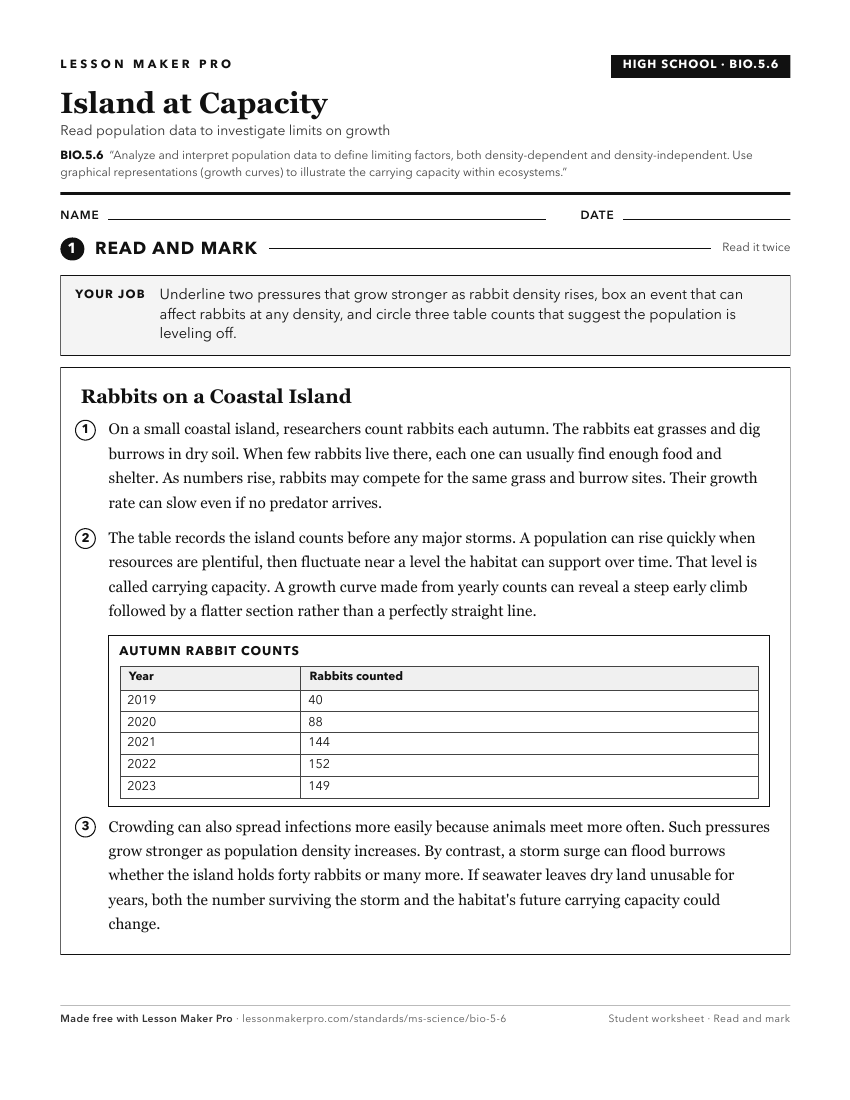
A ready-to-print activity worksheet aligned to BIO.5.6, with an answer key for the teacher on its own page. No account needed.
PDF, US Letter, prints cleanly in black and white.
Download the worksheetKeep exploring
Related Standards
- L.8.4B.1
Analyze and interpret data (e.g., pictures, graphs) to explain how natural selection may lead to increases and decreases in specific traits in populations over ...
- ENV.1.6
Use mathematics, graphics, and informational text to determine how population density-dependent and density-independent limiting factors affect populations and ...
- ENV.1.7
Analyze and interpret quantitative data to construct explanations of how the carrying capacity of an ecosystem may change as the availability of resources chang...
- L.6.3.3
Analyze cause and effect relationships to explore how changes in the physical environment (limiting factors, natural disasters) can lead to population changes w...
Turn this exact standard into a lesson
Grade, subject, topic, and the complete standard are prefilled. Create one free, no account needed.
Also for this standard:Make a WorksheetMake a QuizMake a Sub Lesson